BFCM Cohort Read
BFCM Cohort Read shows how the customers you won over Black Friday and Cyber Monday are doing. It sets them beside every customer you won in the 12 months before the weekend.
The page is ready on December 1, once Cyber Monday ends in your store’s time zone. Until then it shows when each part will be ready. Repeat rate and LTV for the weekend’s customers fill in as 30, 60 and 90 days pass.
How It’s Calculated
The weekend runs from the start of Thanksgiving Thursday to the end of Cyber Monday, in your store’s time zone. In 2026 that’s November 26 to November 30. The page has no date range, Segment or Compare setting, and always covers that weekend.
When Each Part Is Ready
Until Cyber Monday ends in your store’s time zone, the page is forming. It shows a card that says Your BFCM 2026 cohort is still forming, with a row of dates for when each part fills in. The table, chart, profit card and product lists don’t show yet.
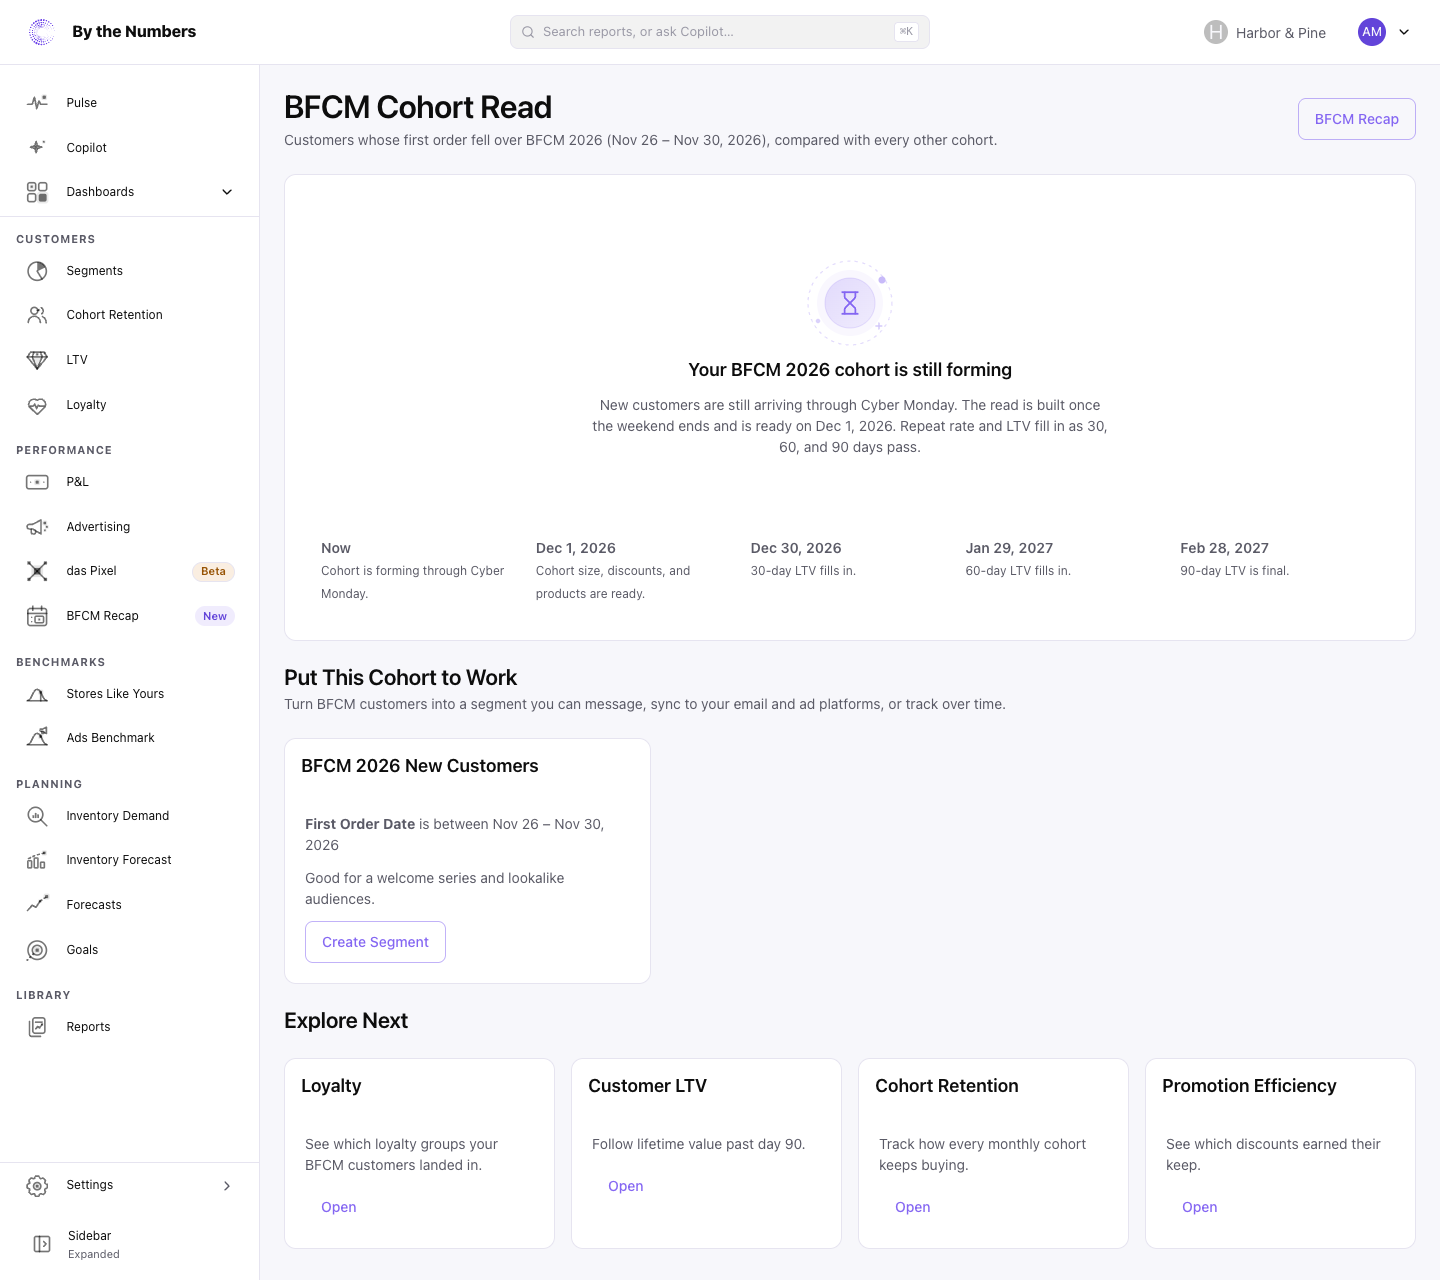
From the first hour after Cyber Monday ends, the page fills in. Each part has its own date. Where a figure isn’t there yet, the page shows Ready and the date.
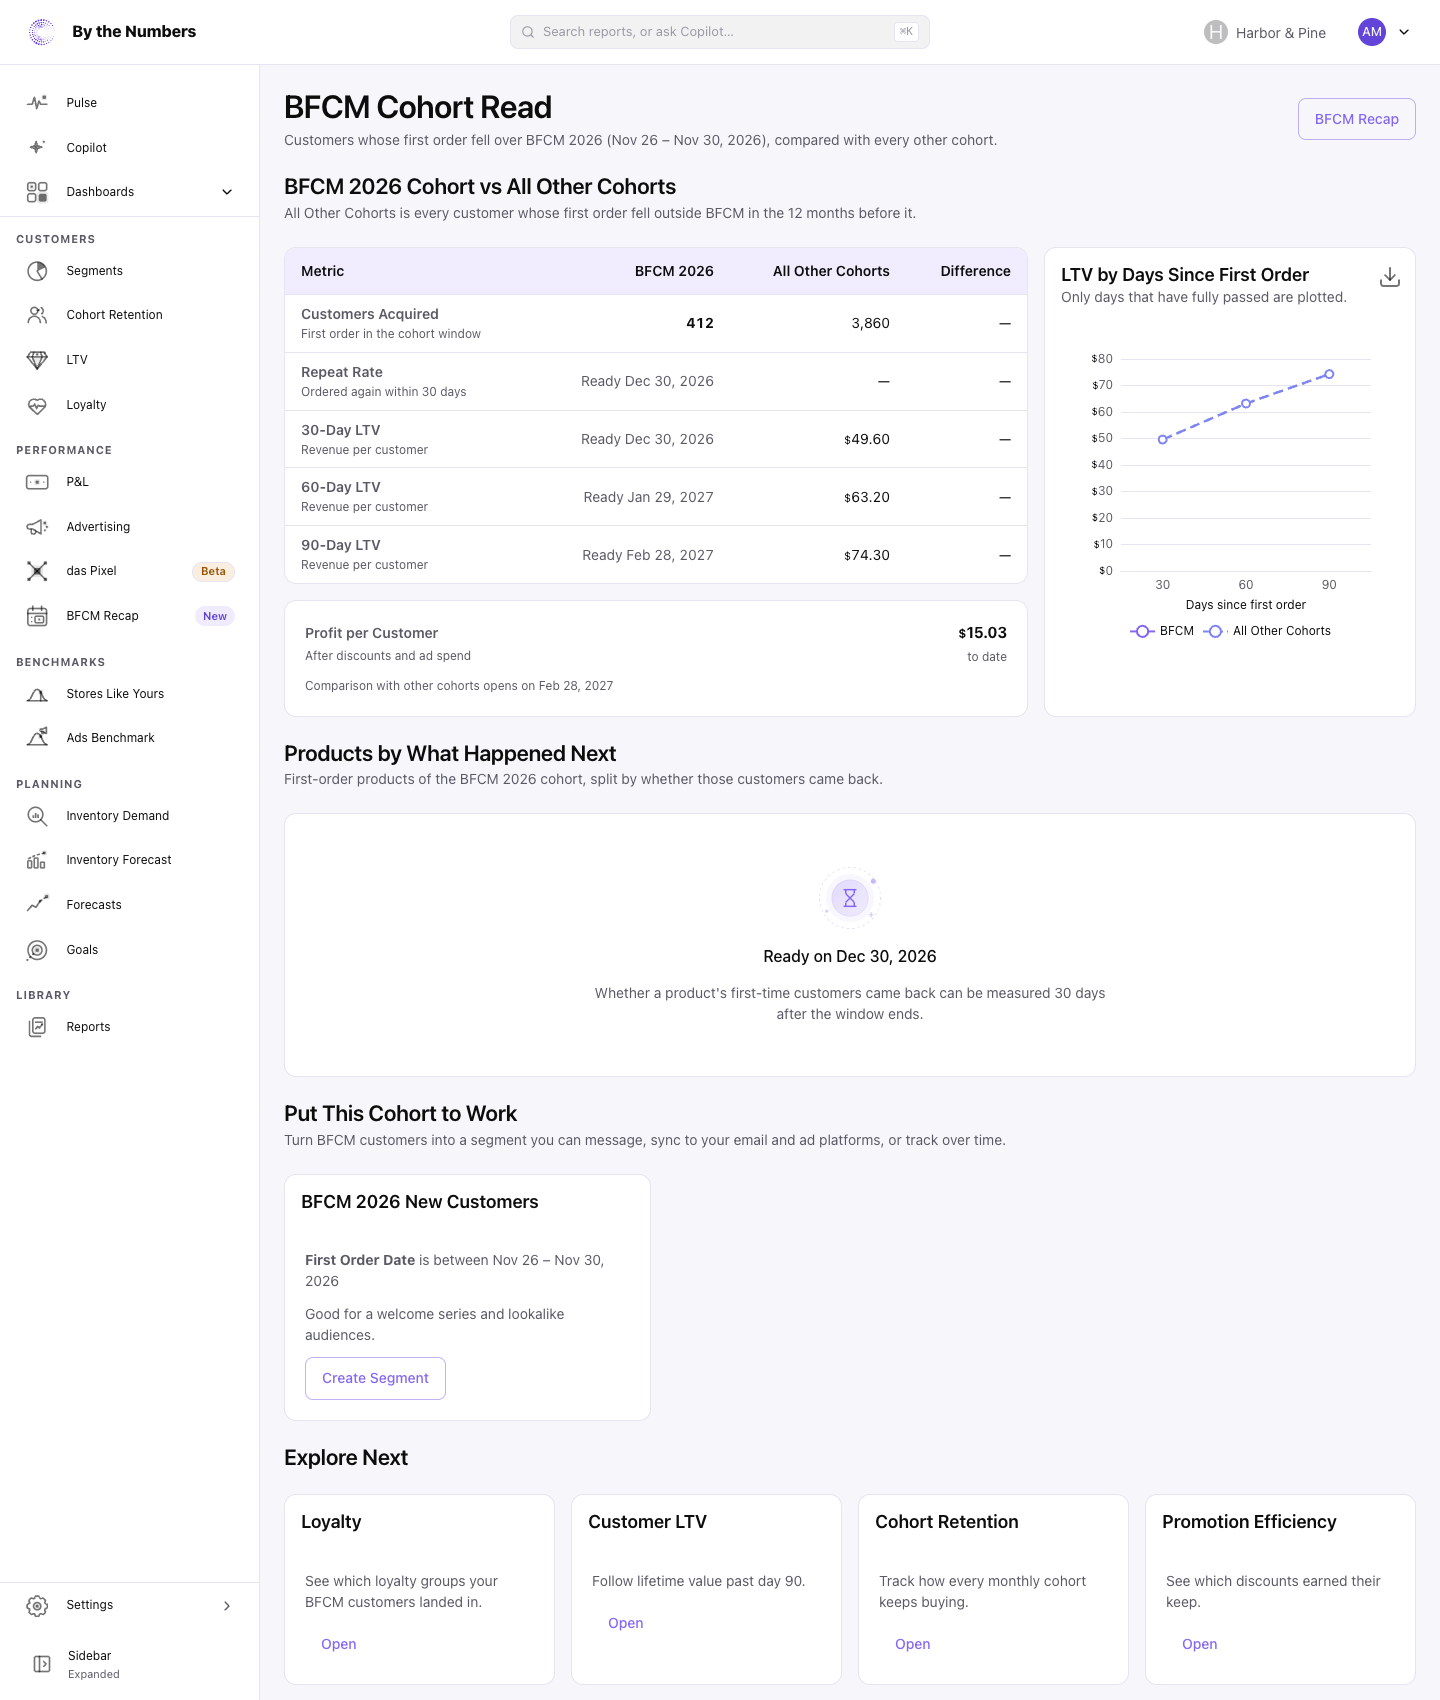
- December 1: Customers Acquired, the figures for All Other Cohorts, and Profit per Customer for the weekend alone, when the profit card shows for your store.
- 30 days after Cyber Monday: the weekend’s 30-day repeat rate and LTV, and the product lists.
- 60 days after Cyber Monday: the weekend’s 60-day figures.
- 90 days after Cyber Monday: the weekend’s 90-day figures, and the profit comparison, if your ad spend history allows it.
The Put This Cohort to Work and Explore Next sections are on the page from the start, even while it is forming.
Who Is in Each Group
A customer is in the BFCM cohort when their first order ever was placed over the weekend. A customer who ordered before the weekend isn’t in it, however much they spend during it.
All Other Cohorts is every customer whose first order was in the 12 months before the weekend.
- Orders with no customer attached aren’t counted.
- Orders that were canceled, or whose payment was voided or expired, don’t count. They can’t be a customer’s first order either.
- Customers come from your customer data, which refreshes on its own schedule. Until it refreshes after the weekend ends, customers from the last days of the weekend can be missing. A note at the top of the page says so.
The Table
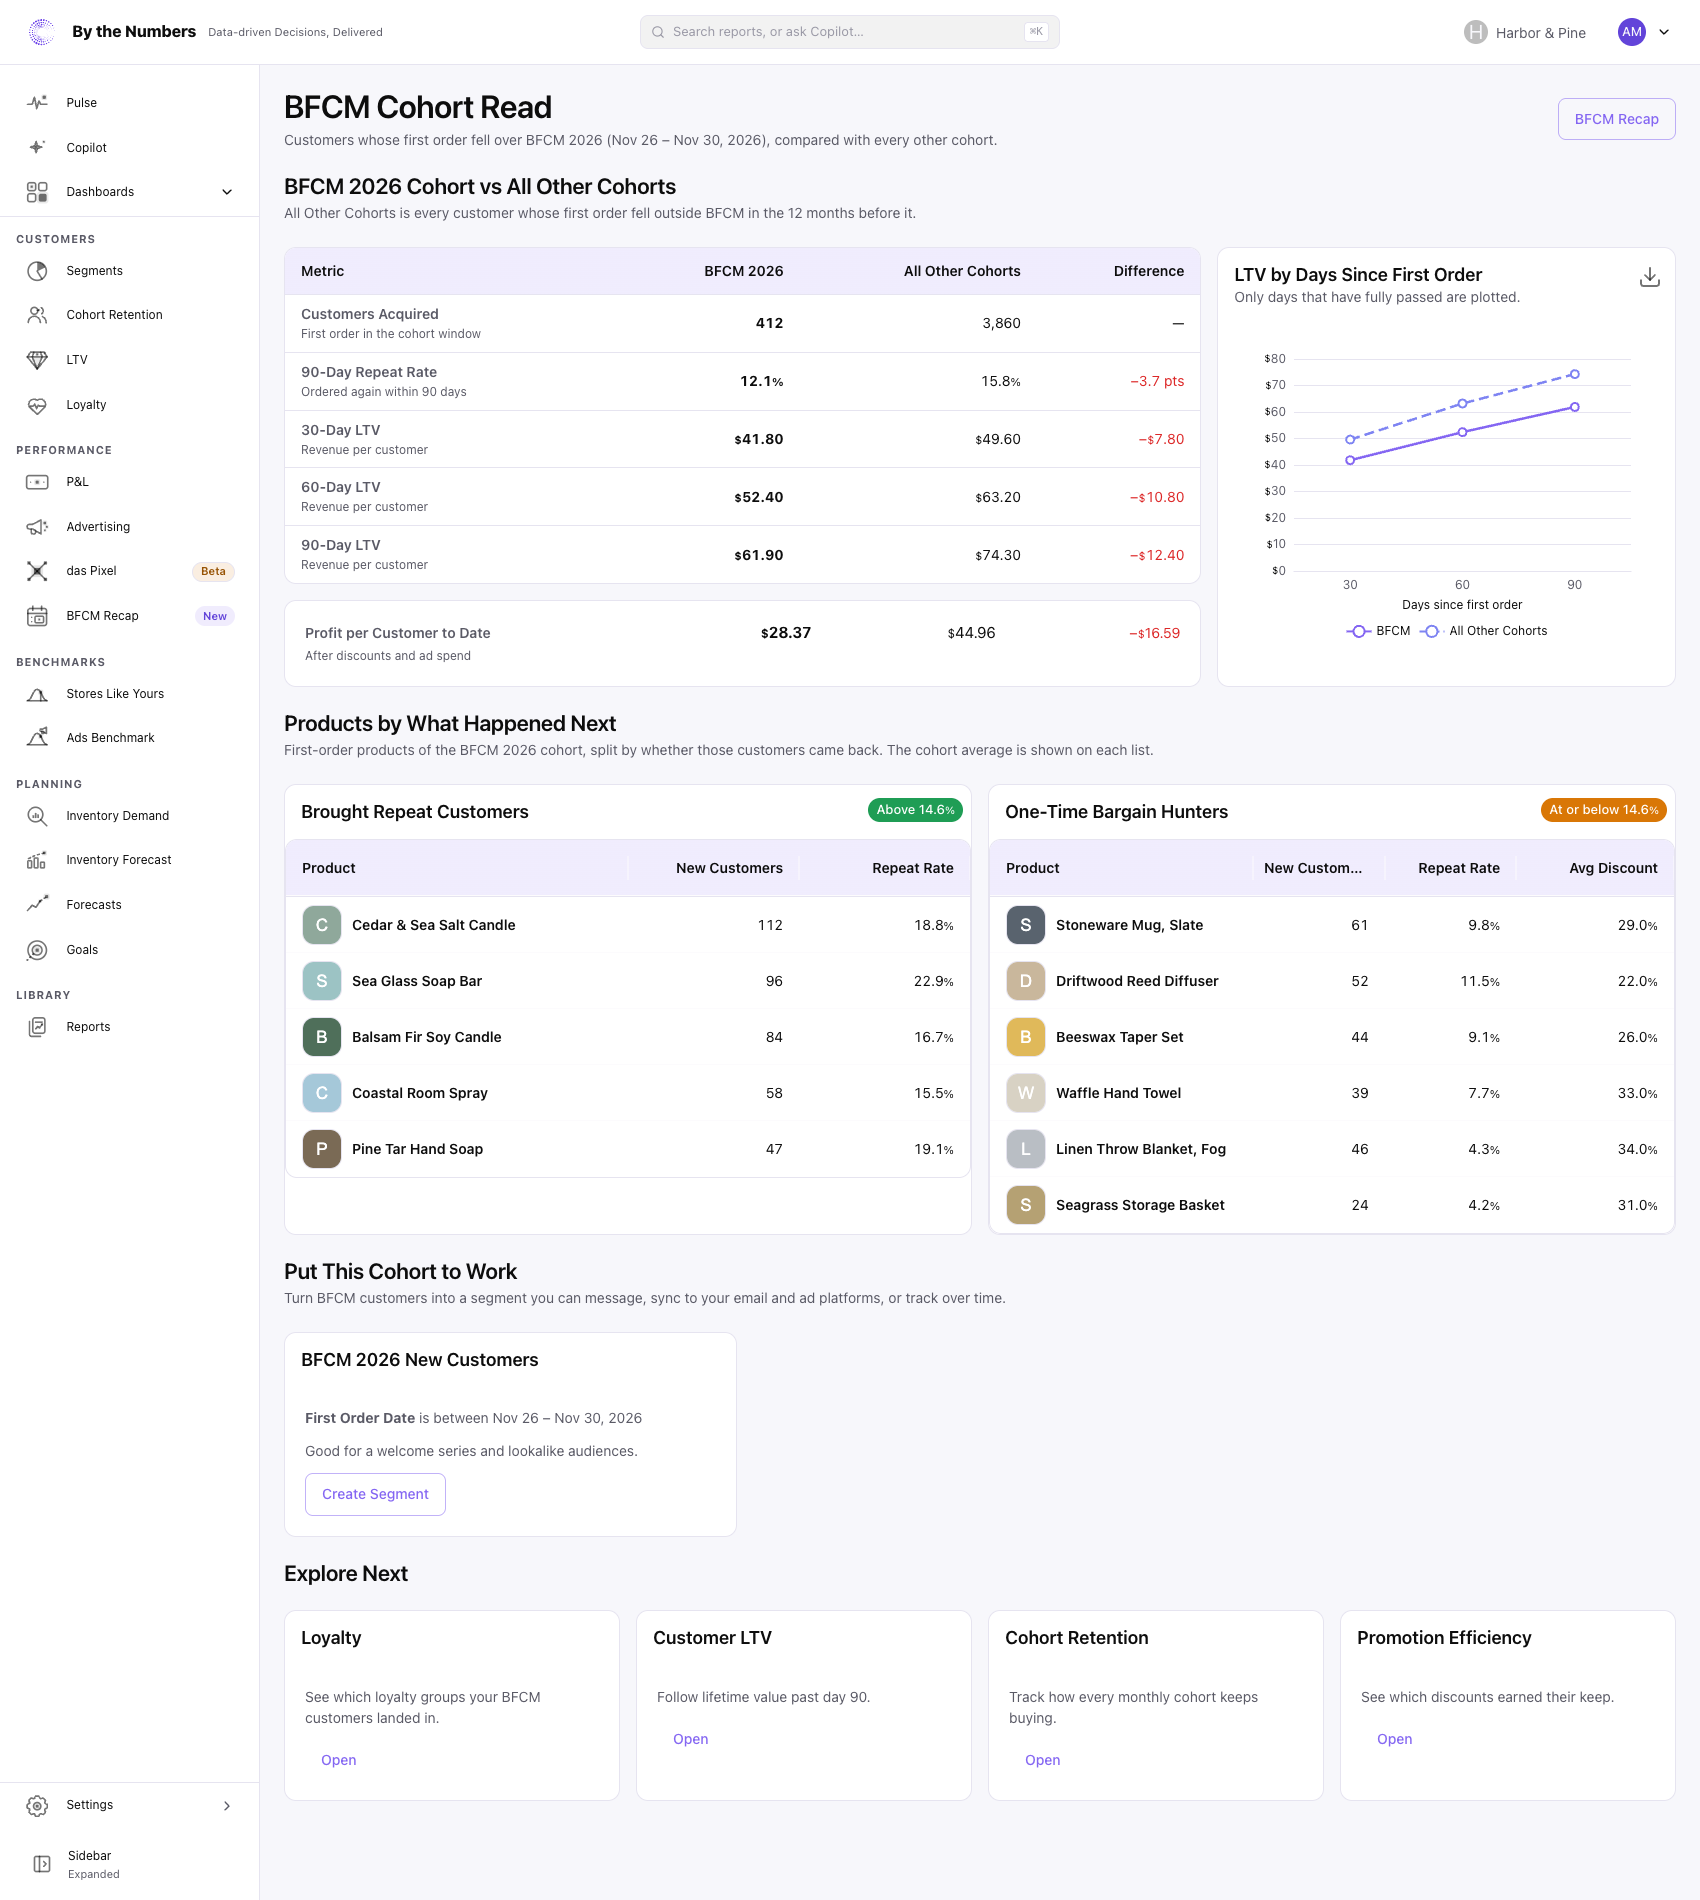
The table has a column for BFCM 2026, one for All Other Cohorts and one for Difference. In Difference, green with a plus sign means the weekend’s customers did better. Red with a minus sign means worse.
- Customers Acquired: the customers in each group. Difference shows
—for this row. - Repeat Rate: the share of customers who ordered again within 30, 60 or 90 days. The row is named for the longest of those that both groups have reached, such as 30-Day Repeat Rate. Difference counts in percentage points.
- 30-Day LTV, 60-Day LTV and 90-Day LTV: revenue per customer. It’s what the average customer spent in the first 30, 60 or 90 days after their first order, first order included.
A customer counts as coming back when they placed a later order at least 24 hours after their first. An order less than 24 hours after the first doesn’t count. Time is counted in whole days, so a 30-day figure includes an order placed 30 days and 23 hours after the first.
LTV adds up what each customer paid on orders placed within 30, 60 or 90 days of their first. That’s each order’s gross sales less discounts, plus shipping and tax, as in Total Sales, less the refunds on those orders. It’s the average across the customers measured.
Both groups are measured at the same age. A figure for the weekend’s customers waits until every customer in the cohort has had that many days. A customer in All Other Cohorts counts toward a figure once that customer is old enough.
The Chart
LTV by Days Since First Order draws the 30, 60 and 90-day LTV for both groups. A point appears only when that day’s figure is ready, and nothing is drawn between points.
The weekend’s customers are the solid line. All Other Cohorts is the dashed one.
Profit per Customer
Profit per customer is what each customer left you after the cost of goods and ad spend, to date. It’s the gross profit on every order the group has placed so far, less the ad spend recorded for the group’s first-order days, divided by the customers in the group.
- Gross profit is the same Gross Profit (Total Sales) as in Profit & Margin: Total Sales, after returns, less the cost of goods. A product with no cost counts as a cost of zero, so profit reads high until you enter it.
- Ad spend is everything your connected ad platforms recorded on those days, whether or not an ad brought the customer. For the weekend’s customers, that’s the 5 days of the weekend.
- The figure is to date, not by age. All Other Cohorts were won before the weekend, so they have had more time to buy and earn.
The card shows only when at least one product has a cost and your ad platforms recorded spend over the weekend. Otherwise it asks for what’s missing.
- Connect Product Costs to See Profit: no product has a cost yet. The Connect Costs button opens your cost settings, and How to Enter Your Costs explains them.
- Connect an Ad Platform to See Profit: costs are in, but no ad platform is connected, or none recorded spend over the weekend. The Connect Ads button opens Integrations.
The comparison opens 90 days after the weekend, and only when your ad spend history goes back to the start of the 12 months before it. Until then the card shows Profit per Customer for the weekend alone, marked “to date”, and the date the comparison opens. If your ad spend history is shorter, the card shows the weekend alone with no date, and the comparison stays closed.
Products by What Happened Next
The two lists split the products on the weekend customers’ first orders by whether those customers came back. They’re ready 30 days after the weekend ends. Before that, the section shows the date it will be ready.
- A product is listed when at least 5 of the weekend’s customers had it on their first order. Up to 50 products are listed between the two lists, the ones with the most customers first.
- New Customers: how many of the weekend’s customers had the product on their first order. A customer who had 2 listed products is counted under each.
- Repeat Rate: the share of those customers who placed any later order, at least 24 hours after the first. Unlike the table, it isn’t limited to 30, 60 or 90 days.
- Avg Discount: the average share of list price taken off those customers’ first orders. It’s on One-Time Bargain Hunters only.
The badge on each list shows the average Repeat Rate across all the listed products. A product is under Brought Repeat Customers when its rate is above that average, and under One-Time Bargain Hunters when it’s at or below it.
While nobody has come back, both lists are empty and there is no badge.
What Good Looks Like
Read Difference first. For repeat rate and LTV, it compares the weekend’s customers with your other customers at the same age. That answers whether the weekend brought customers who stay.
What’s healthy depends on how often your product is bought again. Judge the weekend’s customers against your other customers, not against another store.
A weekend discount can bring customers who buy once. The One-Time Bargain Hunters list shows whose first-time customers came back least. Its Avg Discount column shows how deep the discount on those first orders was.
Wait until the profit comparison opens, 90 days after the weekend, before judging profit. Even then the other cohorts have had longer to earn, so a gap in their favor says less than it looks.
What to Do About It
- Feature the products that brought people back. Put the products under Brought Repeat Customers in your welcome series and follow-up emails.
- Check the discounts. For products under One-Time Bargain Hunters, open Promotion Efficiency by Product to see which discounts earned their keep.
- Message the weekend’s customers. Create Segment opens the segment builder already filled in with the weekend’s first order dates, named BFCM 2026 New Customers. How to Create a Custom Segment covers saving and syncing it.
- Follow them for longer. In Cohort Retention, with Group By on Month, the weekend’s customers sit in the November 2026 cohort, with everyone else whose first order was that month.
Where to Find It
- BFCM Cohort Read: open Reports and look under Customers. The BFCM Cohort Read button at the top of BFCM Recap opens it too.
- BFCM Recap: how your past Black Friday to Cyber Monday weekends did against a normal week.
- Cohort Retention: how many of each monthly cohort ordered in each month after their first.