Cart & Checkout Abandonment Value
Cart & Checkout Abandonment Value shows how many visits started checkout and didn’t buy, the value left in those carts, and how many were recovered later.
How It’s Calculated
Each row of the table is one period. A period is an hour for a date range of up to 3 days, a day for up to 93 days, and a month beyond that. A session counts in the period where it started.
The columns from das Pixel are:
- Checkouts Started: sessions that started checkout.
- Checkouts Completed: sessions that ended in a purchase.
- Checkouts Abandoned: sessions that started checkout and didn’t buy.
- Abandonment Rate: Checkouts Abandoned divided by Checkouts Started.
- Completed Revenue: the value of the purchases. It is the total of the Shopify order each purchase links to: items minus discounts, plus shipping, plus tax that isn’t already in the prices, minus refunds. Where das Pixel couldn’t match an order, it uses the value it saw at checkout.
- Est. Abandoned Value: the value left in the abandoned checkouts. It is an estimate, not lost revenue.
- Avg Items per Abandoned Cart: the average number of cart lines in the abandoned checkouts that viewed the cart. It is blank when none did.
Checkouts Completed counts every session that bought, including one with no checkout start recorded, such as an express checkout. It can therefore be higher than the sessions that started checkout and bought.
Est. Abandoned Value uses the real cart total for each abandoned checkout where das Pixel saw the cart page. For the rest, it uses the period’s average order value, which is Completed Revenue divided by Checkouts Completed.
In a period with no completed checkouts, the average is 0.
The columns from Shopify are:
- Recovered Checkouts: checkouts that were completed in the period.
- Recovered Value: the total price of those checkouts.
- Recovery Rate: Recovered Checkouts divided by the checkouts Shopify recorded as created in the same period.
- Recovered < 1h, Recovered 1h–1d, Recovered 1d–7d and Recovered 7d+: how long after the checkout was created it was completed.
These come from Shopify’s own checkout record, not from das Pixel. They are blank when that record isn’t available for your store. A recovered checkout counts in the period it was completed, so a period can show more recoveries than checkouts created, such as when an old backlog clears.
Select a row to open Sessions Explorer with the abandoned checkouts of that period. Hourly rows don’t link.
Summary Cards and Chart
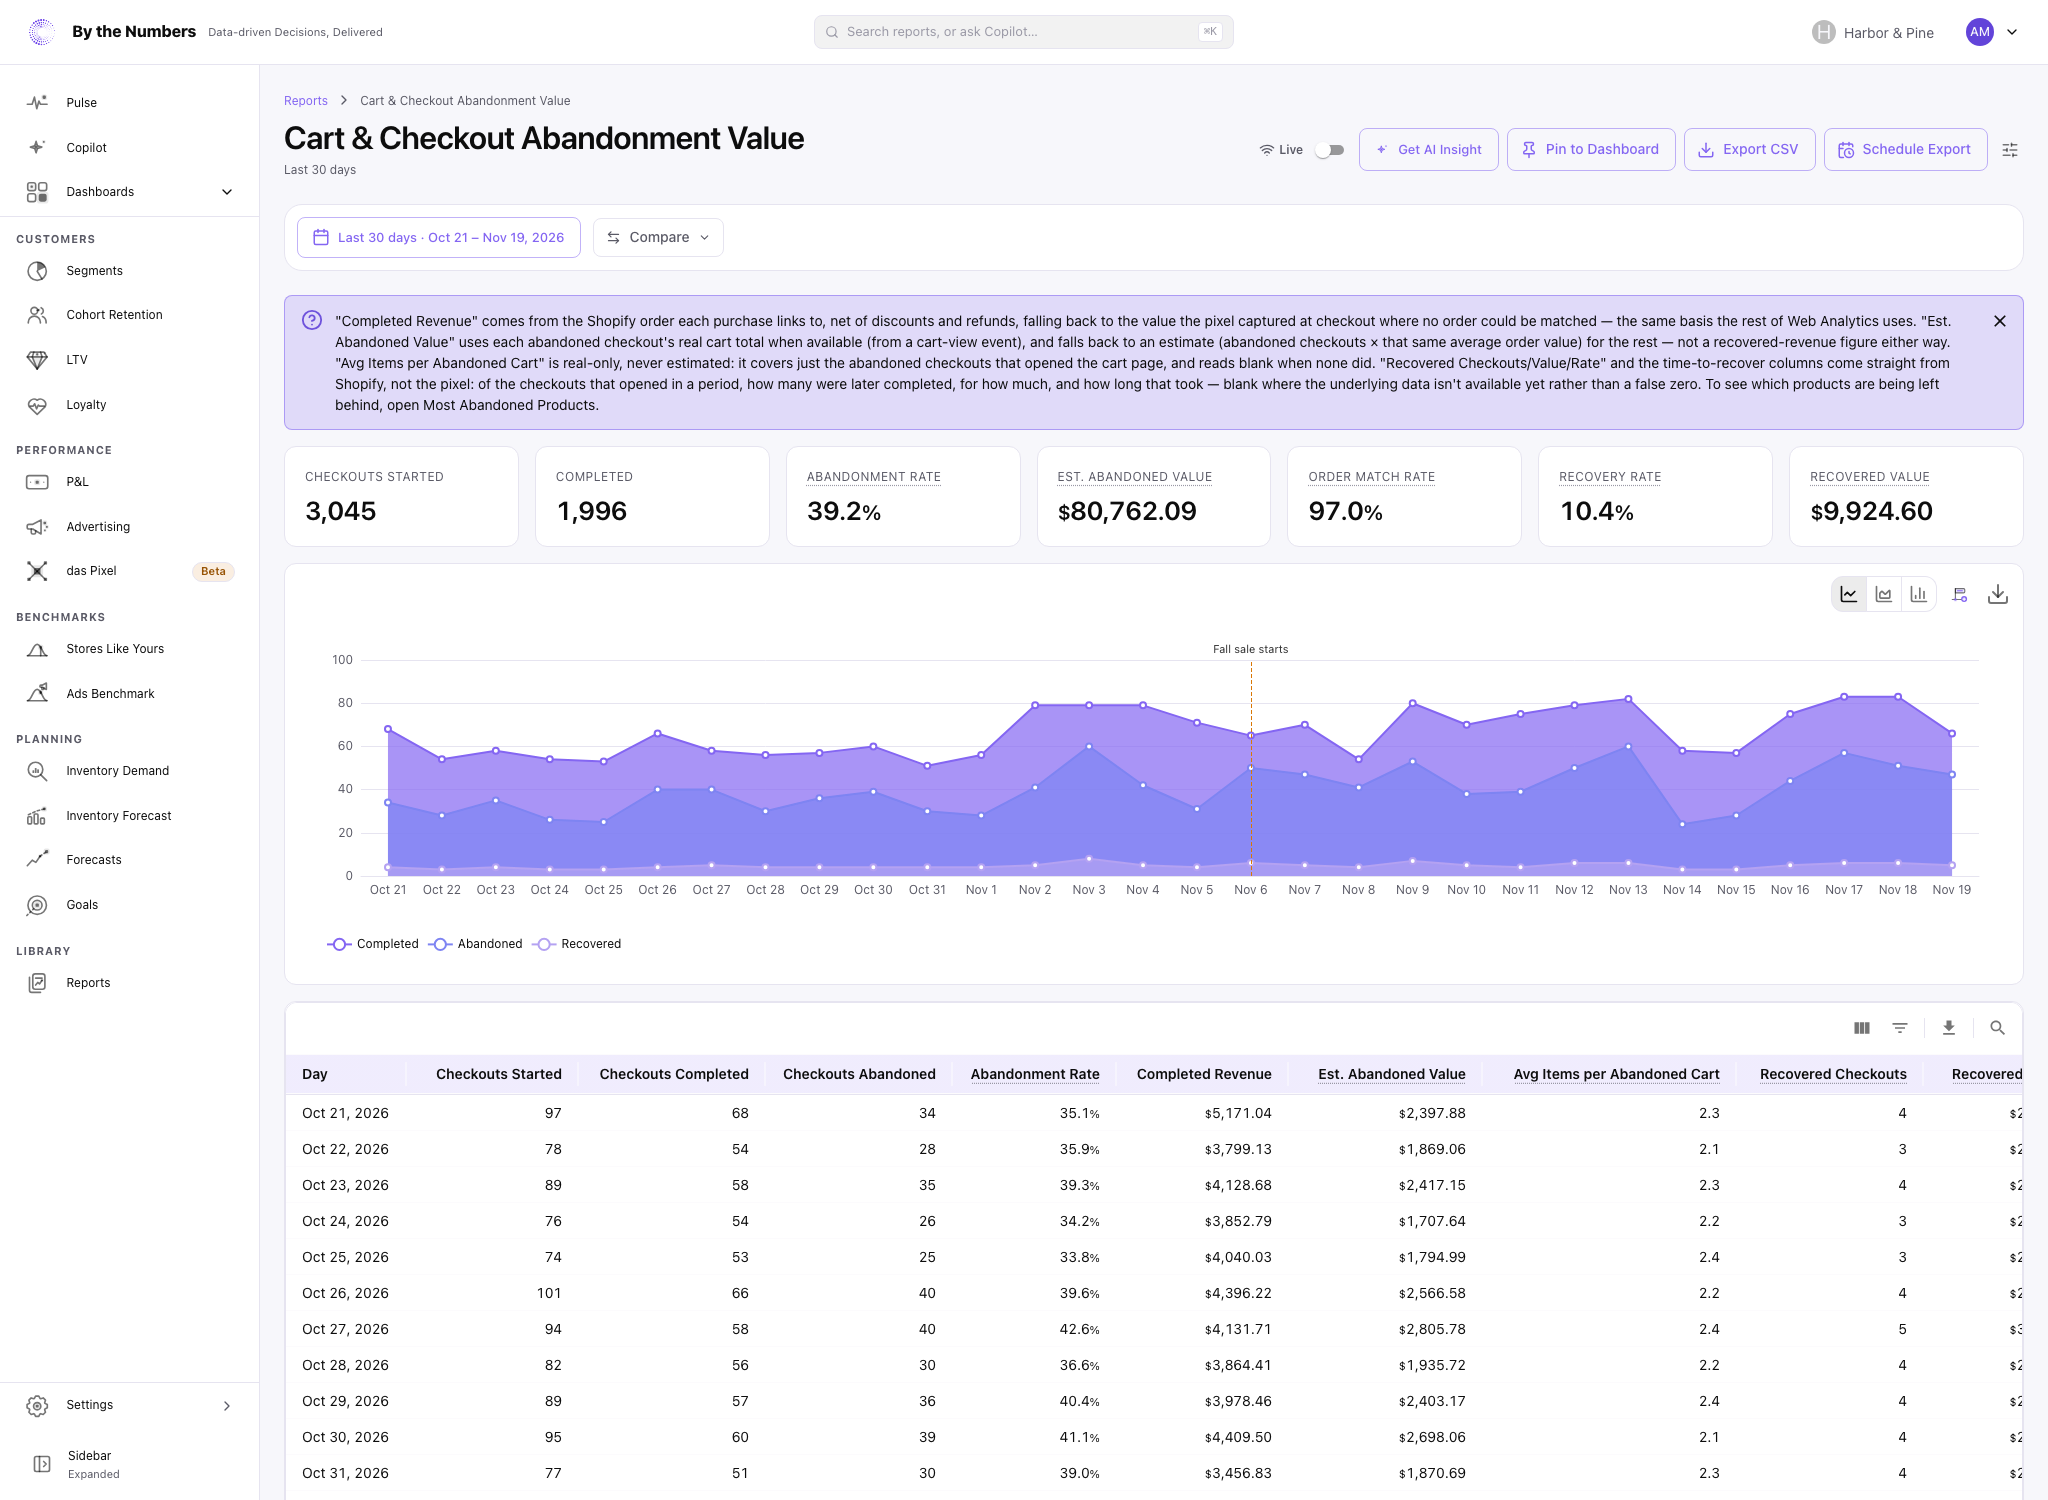
The 7 cards above the table are Checkouts Started, Completed, Abandonment Rate, Est. Abandoned Value, Order Match Rate, Recovery Rate and Recovered Value. They cover the whole date range.
Order Match Rate is the share of completed checkouts valued from their Shopify order. With Compare on, each card except Order Match Rate shows its change.
The chart draws Completed, Abandoned and Recovered checkouts per period. Switch it between an area, a line and bars.
What Counts
- Visitors who declined analytics cookies, or who opted out of the sale or sharing of their data while Require Sale-of-Data Consent is on, aren’t recorded. Known bots are left out.
- Only events inside the date range count, in your store’s time zone.
- das Pixel started recording the cart page on July 24, 2026. Before that day, Est. Abandoned Value uses the average order value for every abandoned checkout, and Avg Items per Abandoned Cart is blank.
- A cart total shown in a currency other than your store’s isn’t converted.
- Turn on Live to refresh the report every 30 seconds. Without it, a figure can be up to 10 minutes old.
A warning shows above the report when das Pixel saw less than 70% of your online-store orders in the last 30 days. This report has no Segment, Sales Channel or Filters control.
What Good Looks Like
There’s no target. Watch the Abandonment Rate over time, and look for a change after you alter shipping, payment options or checkout.
Est. Abandoned Value shows what is at stake. It isn’t what you would earn by recovering every cart, because many visitors never intended to buy.
What to Do About It
- A rising Abandonment Rate: check what changed on those days, such as shipping costs, a payment option or a slow page.
- A large Est. Abandoned Value: send reminder emails to customers who left their email at checkout.
Most Abandoned Products shows which products visitors leave behind.
Get AI Insight at the top of the report asks Copilot for a short read of it.
Where to Find It
- Cart & Checkout Abandonment Value: open Reports and look under Web Analytics. It appears there once das Pixel is connected.