Sessions Explorer
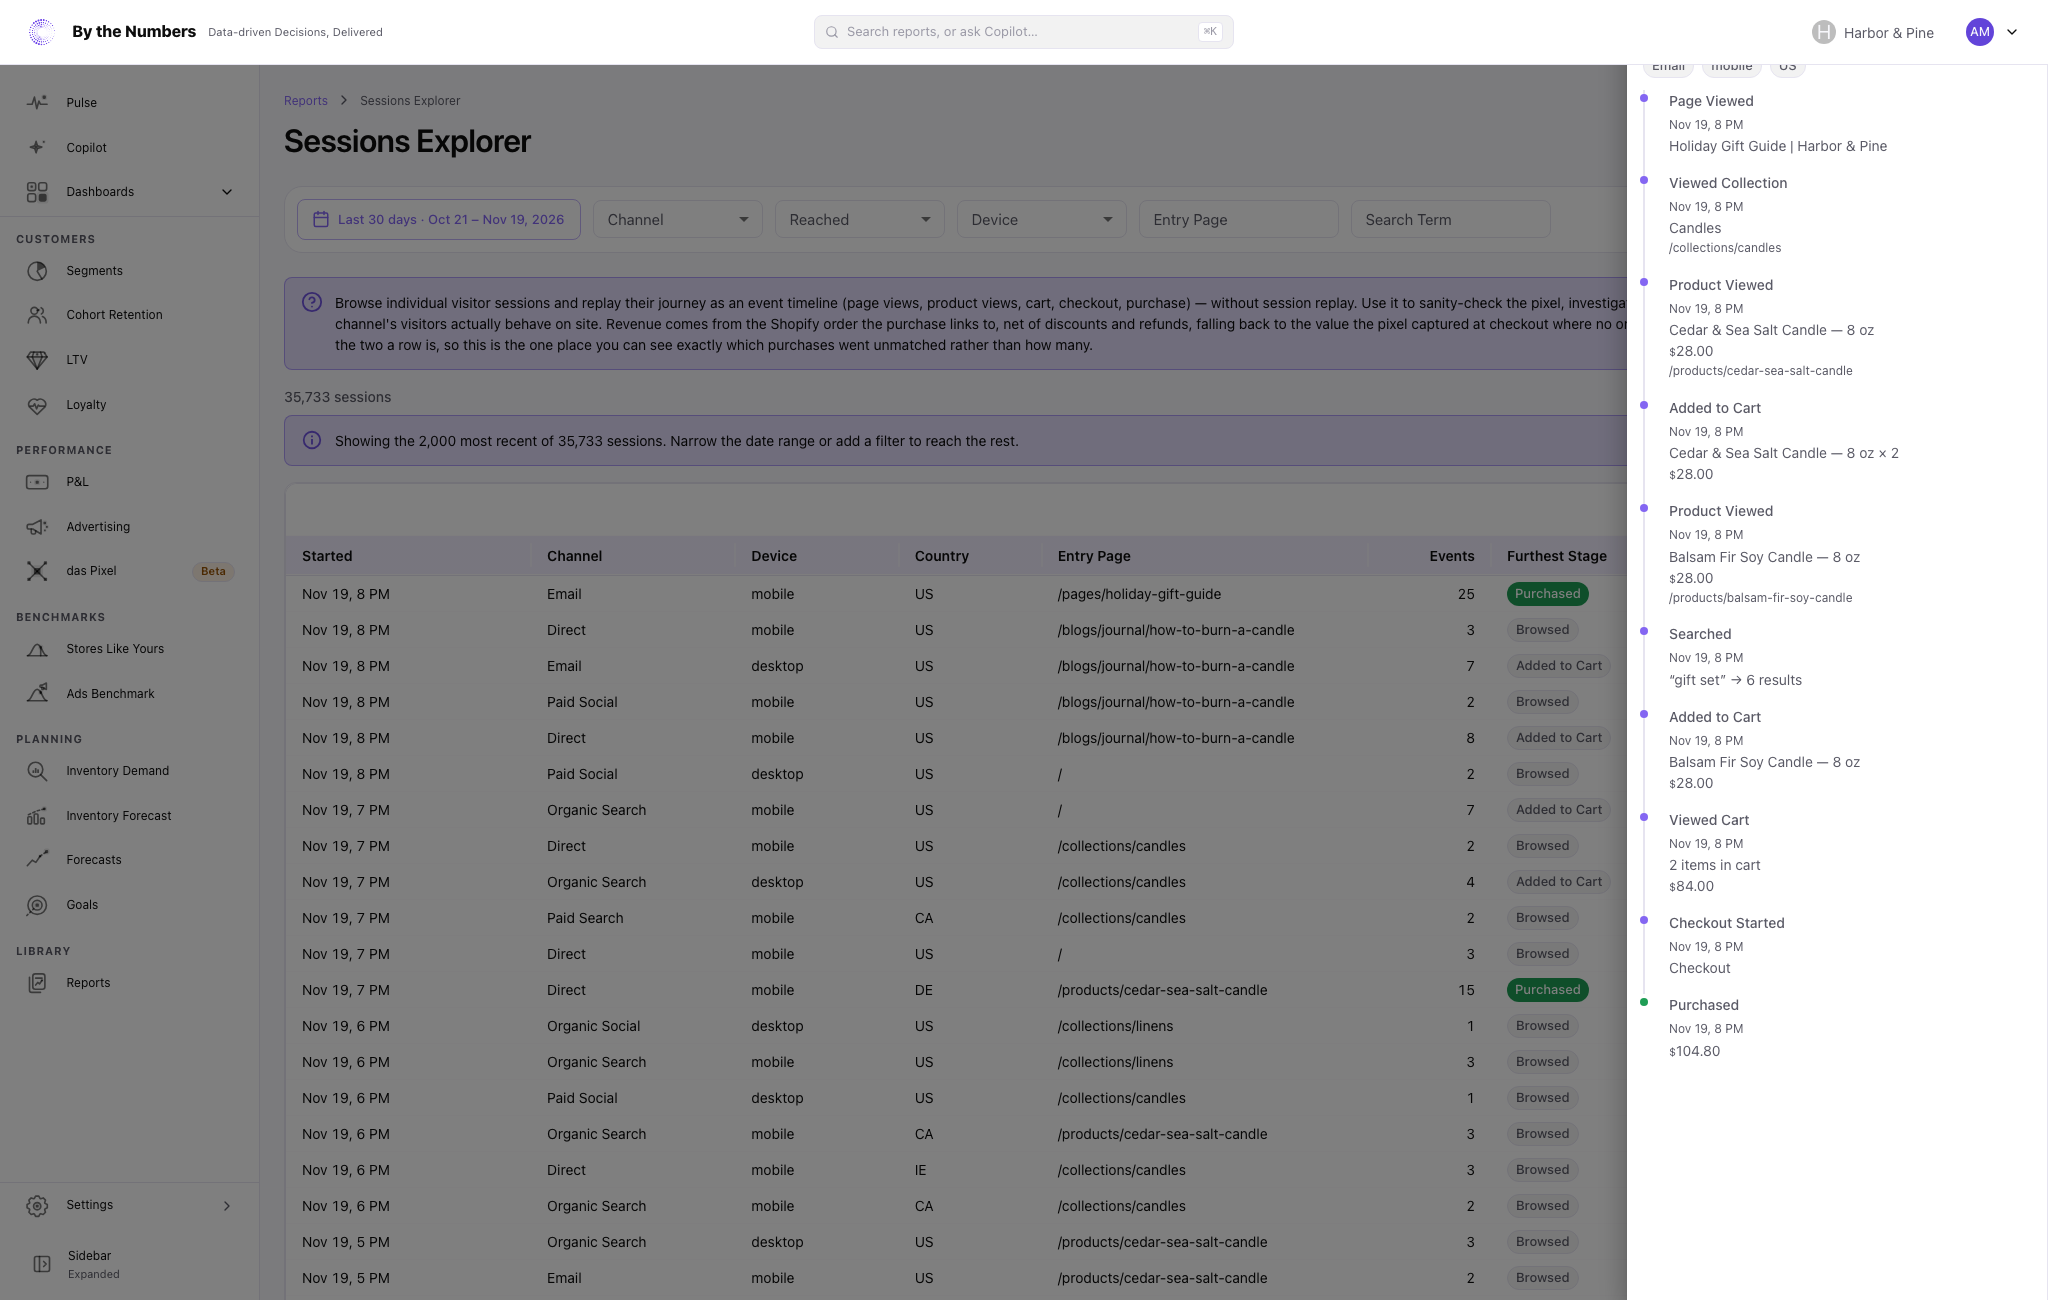
Sessions Explorer lists individual visits to your store, newest first, and shows each one as a timeline of what the visitor did.
How It’s Calculated
Each row is one session. The columns are:
- Started: when the session’s first event inside the date range happened.
- Channel: how the session first arrived. The channel rules are the ones in Sessions by Source & Channel.
- Device:
desktop,mobile,tabletorother. - Country: the visitor’s country code.
- Entry Page: the address of the first page view.
- Events: the number of events recorded in the session.
- Furthest Stage: how far the visit got. It shows Purchased, Reached Checkout, Viewed Cart, Added to Cart, Viewed Product or Browsed, whichever is furthest.
- Revenue: the value of the purchase, for a session that bought. It is the total of the Shopify order the purchase links to: items minus discounts, plus shipping, plus tax that isn’t already in the prices, minus refunds. Where das Pixel couldn’t match an order, it uses the value it saw at checkout.
- Order Linked:
Yeswhen the purchase matched a Shopify order andNowhen it used the checkout value. It is blank for a session that didn’t buy.
Order Linked is the one place that shows which individual purchases went unmatched.
Select a row to open Session Timeline. It lists the session’s events in order, with the time, the page, product, search, collection or cart each one involved, and the amount for a purchase.
Above the table, the number of sessions that match your filters is shown. The table shows 50 per page and reaches at most the 2,000 most recent. When there are more, a note says so.
Narrow the date range or add a filter to reach the rest.
Filters
- Channel: one of the 8 channels.
- Reached: sessions that got at least that far. The options are Browsed Only, Viewed a Product, Added to Cart, Viewed Cart, Reached Checkout, Abandoned Checkout and Purchased. Browsed Only is sessions that reached none of the others. Abandoned Checkout is sessions that reached checkout and didn’t buy.
- Device: Desktop, Mobile, Tablet or Other.
- Entry Page: the exact address, as listed in the Entry Page column.
- Search Term: sessions that searched for exactly that text.
The other Web Analytics reports link here with their own filters. A row in Sessions by Source & Channel opens the sessions behind it. A link can also filter by product or by country, which the page has no control for.
What Counts
- Visitors who declined analytics cookies, or who opted out of the sale or sharing of their data while Require Sale-of-Data Consent is on, aren’t recorded. Known bots are left out.
- Only events inside the date range count, in your store’s time zone.
This page has no Live switch, and no Compare, Segment, Sales Channel or summary cards. A warning shows above the table when das Pixel saw less than 70% of your online-store orders in the last 30 days.
What Good Looks Like
There’s no target. Use the list to check the numbers in another report, to look at a high-value order, or to see how visitors from one channel behave.
A purchase with Order Linked set to No is valued at the checkout value, which can differ from the order.
What to Do About It
- A channel report looks wrong: open its sessions here and read a few timelines.
- A purchase you can’t find in Shopify: filter Reached by Purchased, and check the sessions with Order Linked set to
No. - Visitors that stop at checkout: filter by Abandoned Checkout and look at what they had in the cart.
Where to Find It
- Sessions Explorer: open Reports and look under Web Analytics, or select a row in another Web Analytics report.