Traffic & Conversions
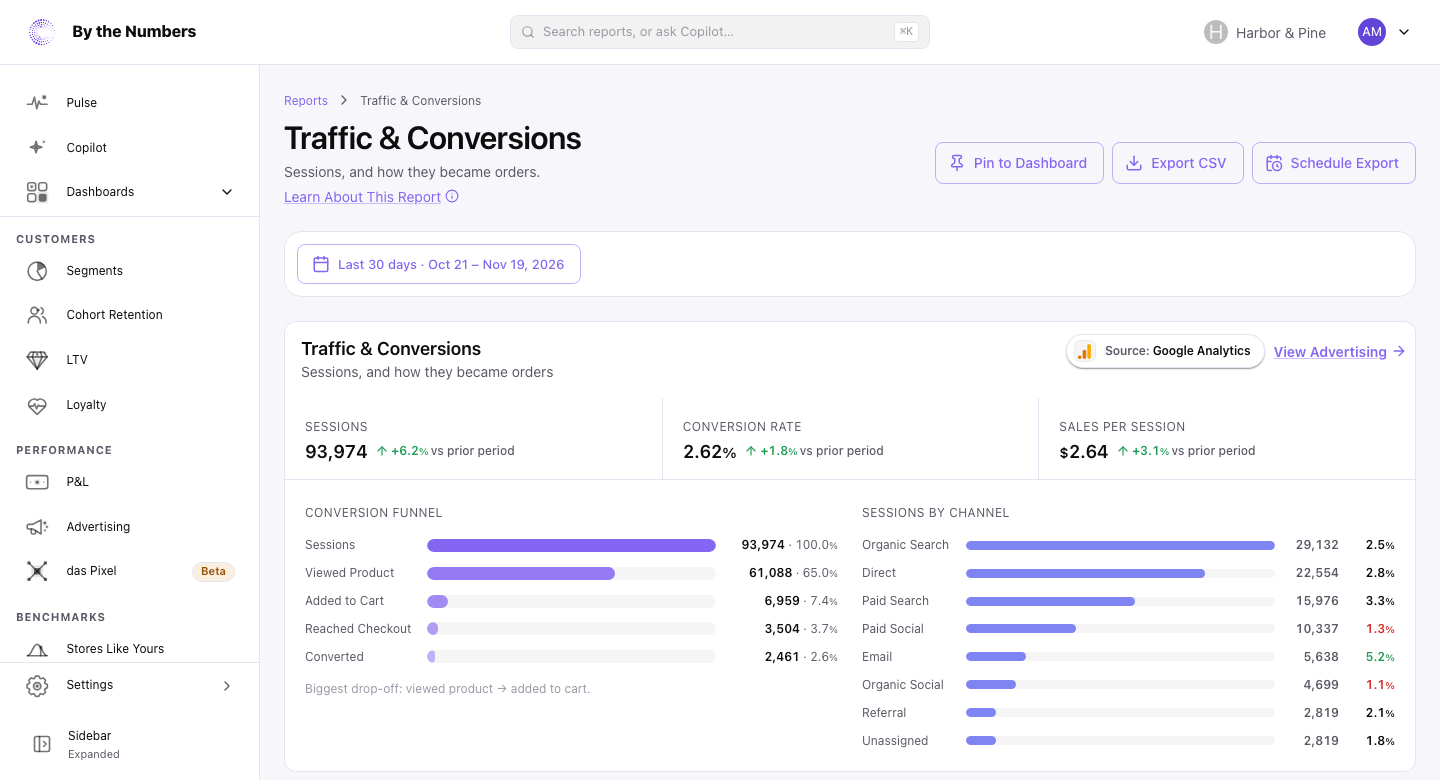
Traffic & Conversions shows your store’s visits and how they turned into orders, on one card: the top-line numbers, the conversion funnel and where the visits came from.
How It’s Calculated
The card has 3 parts. It’s the same card as the traffic section on Pulse.
The top-line figures are Sessions, Conversion Rate and Sales per Session. Each one shows its change from the period just before yours, which is the same number of days ending the day before your range starts. The change is left out when the earlier value is 0 or missing.
The report has no Compare menu, so this is always the comparison.
- Sessions: the number of visits to your store.
- Conversion Rate: the visits that ended in an order, divided by Sessions.
- Sales per Session: your Total Sales for the date range divided by Sessions. Total Sales covers every sales channel, so point of sale counts here too. Total Sales explains it.
The funnel shows 5 stages with a count and a percentage of Sessions: Sessions, Viewed Product, Added to Cart, Reached Checkout and Converted. Conversion Funnel explains them. A line under the stages names the Biggest drop-off: the step that keeps the smallest share of the stage before it, the same step the Conversion Funnel report finds.
Sessions by Channel lists each channel with its sessions and its conversion rate, from the one with the most sessions down. A rate of 3.5% or more shows in green, and a rate under 1.5% in red.
Where the Numbers Come From
The card uses one tracking source at a time, never a mix of two: das Pixel when it’s installed, otherwise your connected Google Analytics property. A badge in the card’s header says which. With neither, the page asks you to install das Pixel or connect Google Analytics.
With das Pixel, a session’s channel is decided from how its first visit arrived. The first rule that matches wins:
- Paid search: a Google Ads or Microsoft Ads click.
- Paid social: a Meta Ads or TikTok Ads click.
- Paid search: a
utm_mediumofcpc,paidorppc. - Organic search: a
utm_sourceofgoogle,bing,duckduckgoorbaidu, with noutm_medium. - Social: a
utm_mediumofsocialorsm, or autm_sourceoffacebook,instagram,tiktok,twitter,linkedin,pinterestoryoutube. - Email:
emailas theutm_sourceorutm_medium. - Referral: a
utm_mediumofreferral. - Organic search: no
utm_sourceor ad click, and the visit came from a search engine: Google, Bing, Yahoo, DuckDuckGo, Baidu, Yandex, Ecosia or Brave. - Social: no
utm_sourceor ad click, and the visit came from a social network such as Facebook, Instagram, X, LinkedIn, Pinterest, Reddit, YouTube or TikTok. - Referral: no
utm_sourceor ad click, and the visit came from any other website. - Direct: the source is
direct, or there’s noutm_source. - Other: everything else.
Rule order matters. A visit from a Meta Ads click is Paid social even if its utm_medium says cpc.
Visitors who decline marketing on your cookie banner have no source recorded, so they land in Direct. A new visit that starts from a page of your own store lands there too.
With Google Analytics, the channels are GA4’s own default channel groups.
What Counts
- A session counts in the period it started. With das Pixel, crawlers and scripted visits are left out.
- Only the date range changes this report. Segment, Sales Channel and Filters don’t apply.
- Export CSV gives the Sessions by Channel list: Channel, Sessions, Conversions and Conversion Rate.
What Good Looks Like
Read the channels for 2 things: where your visits come from, and which channels convert. A channel with many sessions and a low rate brings visits that rarely turn into orders. A channel with few sessions and a high rate may be worth growing.
What’s a good rate depends on what you sell and your price. Compare your store with itself over time.
What to Do About It
- A low rate on a big channel: look at the landing pages that channel sends visitors to, and at Conversion Funnel for where they drop off.
- A high rate on a small channel: put more into it. For paid channels, check the spend on Advertising.
- A large Direct channel: tag your email, social and ad links so visits get a source. How to Tag Your Ads With UTM Parameters shows how.
Where to Find It
- Traffic & Conversions: open Reports and look under Marketing.
- Store Conversion Rate: the overall conversion rate, period by period.
- Conversion Funnel: where visitors drop off on the way to an order.