Inventory Forecast
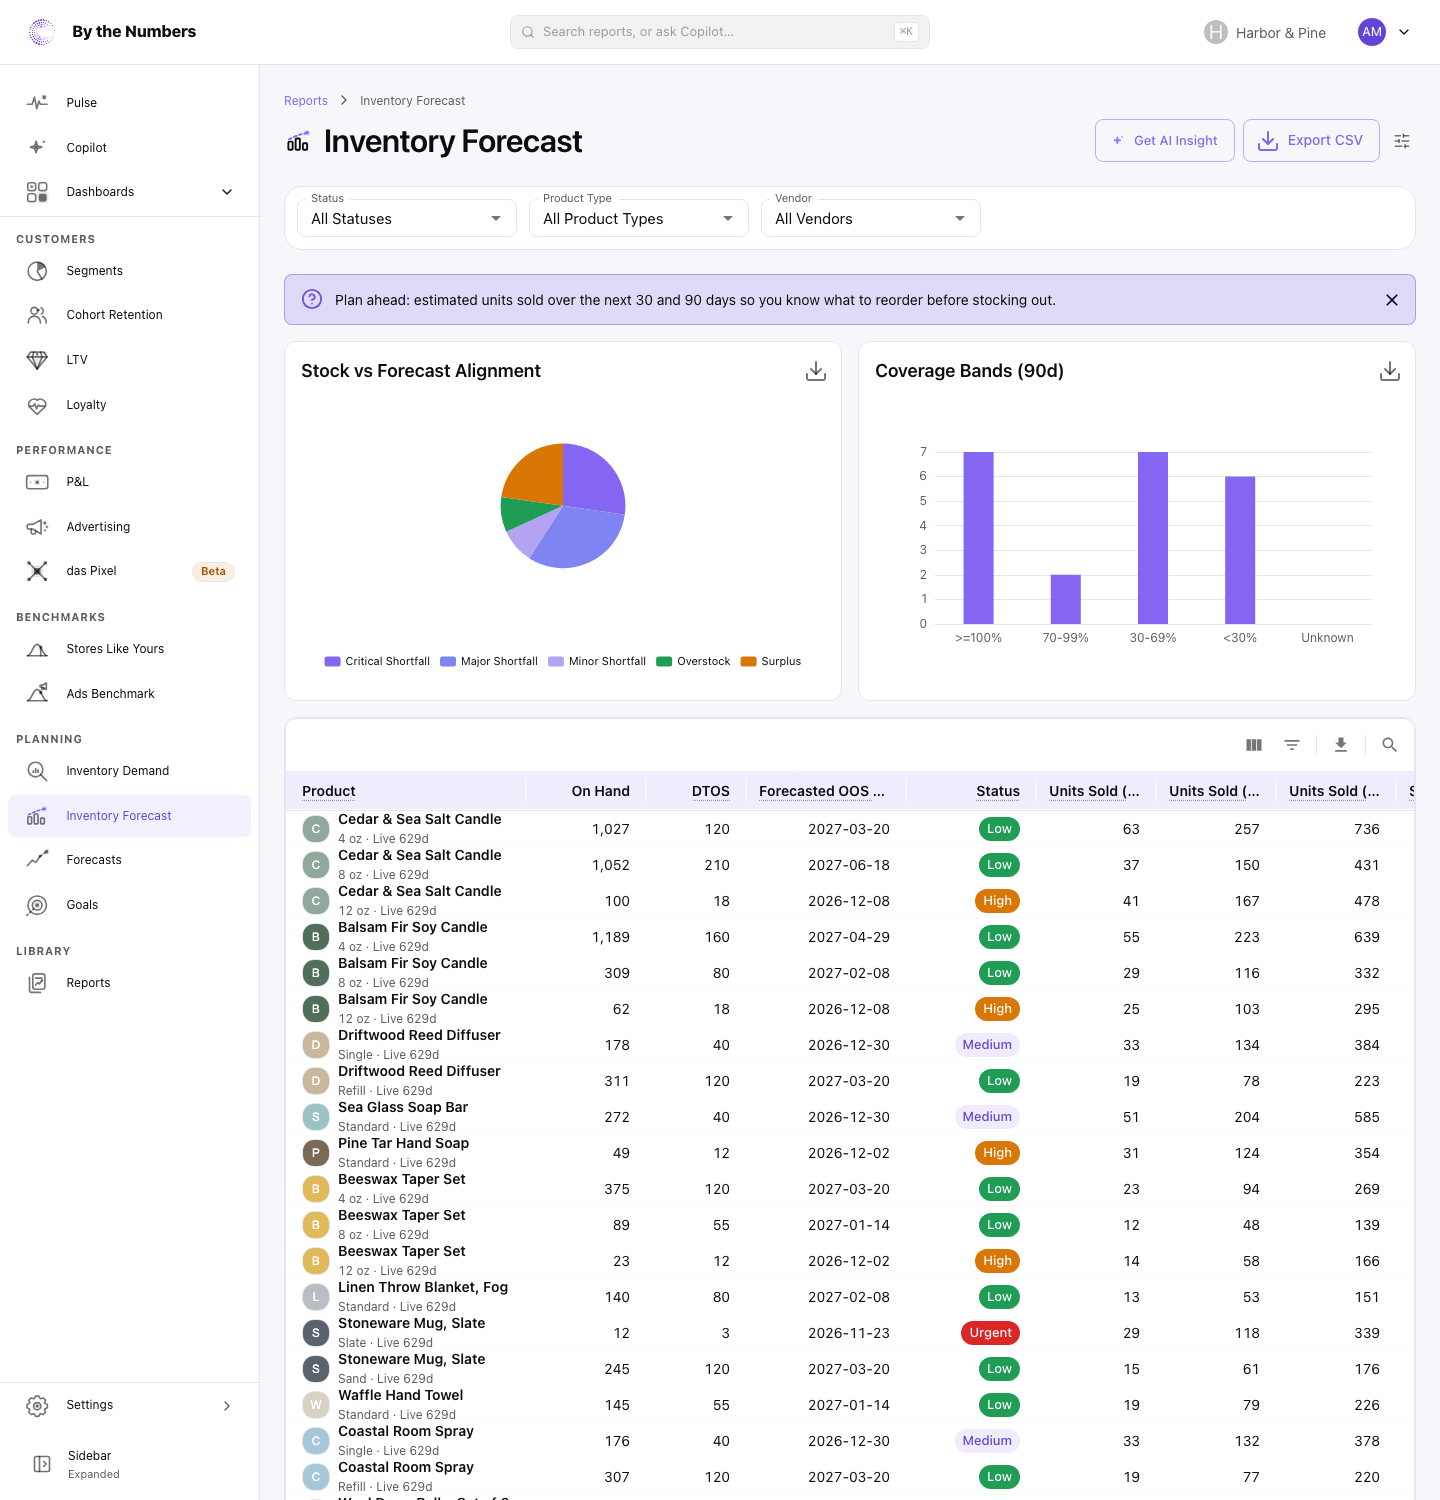
Inventory Forecast estimates how many units of each product variant you’ll sell in the next 30 and 90 days, and whether your stock covers the next 90.
How It’s Calculated
Each row of the table is one variant of an active, published product. Variants with no sales in the last 30 days are listed too. The columns are:
- Product: the product, its variant, and how many days it has been live.
- On Hand: the variant’s stock in Shopify.
- DTOS: days to stockout, which is On Hand divided by the units sold per day over the last 30 days, rounded to a whole day.
- Forecasted OOS Date: the date the report was built, plus the days of stock rounded up.
- Status: the same as on Inventory Demand, which lists each status.
- Units Sold (7d), Units Sold (30d) and Units Sold (90d): units sold in the last 7, 30 and 90 days.
- Sales Trend (vs prior 30d): the change in daily units sold over the last 30 days compared with the 30 days before.
- Forecast Qty (30d) and Forecast Qty (90d): the units you can expect to sell in the next 30 and 90 days.
- Forecasted Revenue (90d): a rough estimate, from Forecast Qty (90d) and the variant’s recent selling prices. It includes tax, and it can come out low when customers buy more than 1 unit on an order line.
- Stock vs Forecast (90d): how your stock compares with 90 days of sales, as described below.
- Coverage % (90d): your days of stock as a percentage of 90 days. 100% is 90 days of stock.
How the Forecast Is Made
The forecast weighs the 3 most recent sales paces: 50% on the last 7 days, 30% on the last 30 days, and 20% on the 30 days before that. Each pace is units per day. That number, times 30 or 90, is Forecast Qty (30d) or Forecast Qty (90d).
It uses recent sales only. It doesn’t allow for seasons, promotions, price changes or stock you’ve ordered but not received. It also doesn’t depend on how much stock you have: it’s the demand you can expect, not the units you can ship.
Stock vs Forecast and Coverage
Stock vs Forecast (90d) and Coverage % (90d) use the 30-day pace, not the forecast. They compare your days of stock with 90 days:
| Stock vs Forecast | Days of stock |
|---|---|
| Overstock | More than 135 |
| Surplus | More than 90, up to 135 |
| Minor Shortfall | More than 63, up to 90 |
| Major Shortfall | More than 27, up to 63 |
| Critical Shortfall | 1–27 |
| Out Of Stock | Less than 1, or On Hand is 0 |
| Oversold | On Hand is below 0 |
| Unknown | The variant sold nothing in the last 30 days |
Out Of Stock and Oversold need sales in the last 30 days. A variant with none is Unknown, whatever its stock.
Coverage % (90d) is the same days of stock divided by 90. The edges above are therefore 150%, 100%, 70% and 30%. It shows a dash for Unknown.
The 2 charts count variants, and follow the filters:
- Stock vs Forecast Alignment: the number of variants in each row of the table above.
- Coverage Bands (90d): the number of variants with coverage of 100% or more, 70–99%, 30–69% or under 30%, and those with no figure.
What Counts
- Sales are the units on orders from every sales channel. Orders that were canceled, or whose payment was voided or expired, don’t count.
- Refunds and returns aren’t taken off.
- “Last 7 days” and “last 30 days” run back from the moment the report was built, not from midnight.
- On Hand comes from your product list. The report is rebuilt each time that list refreshes, usually every 8–12 hours: see How Often Is My Data Updated?.
- The page doesn’t show when it was last built.
The report has no date range, Segment or Sales Channel. Filter it with Status, Product Type and Vendor.
What Good Looks Like
A variant with coverage of 100% or more has stock for the next 90 days at its 30-day pace. Whether that’s enough depends on how long your supplier takes. A variant that takes 8 weeks to restock needs more than 56 days of stock.
Overstock, which is above 150% coverage, is stock that takes more than 135 days to sell at the current pace.
What to Do About It
- Critical Shortfall and Major Shortfall: reorder. Start with the variants that have the highest Forecast Qty (90d).
- Overstock: pause reorders and consider a promotion. Check Sales Trend (vs prior 30d) to see whether sales are falling.
- A trend that’s rising fast: the 30-day pace understates demand. The variant may run out sooner than DTOS says.
- Planning a purchase: use Forecast Qty (90d) for the units to order, minus On Hand.
Get AI Insight at the top of the report asks Copilot for a short read of it. Export CSV downloads the table as it’s filtered, with the product ID, variant ID and SKU added.
Where to Find It
- Inventory Forecast: Inventory Forecast in the navigation, under Planning.
- Inventory Demand: how long the stock will last at the recent pace.