AI Assistant Traffic
AI Assistant Traffic shows the orders and sales that came from an AI assistant, such as ChatGPT, Gemini, Perplexity, Copilot or Claude.
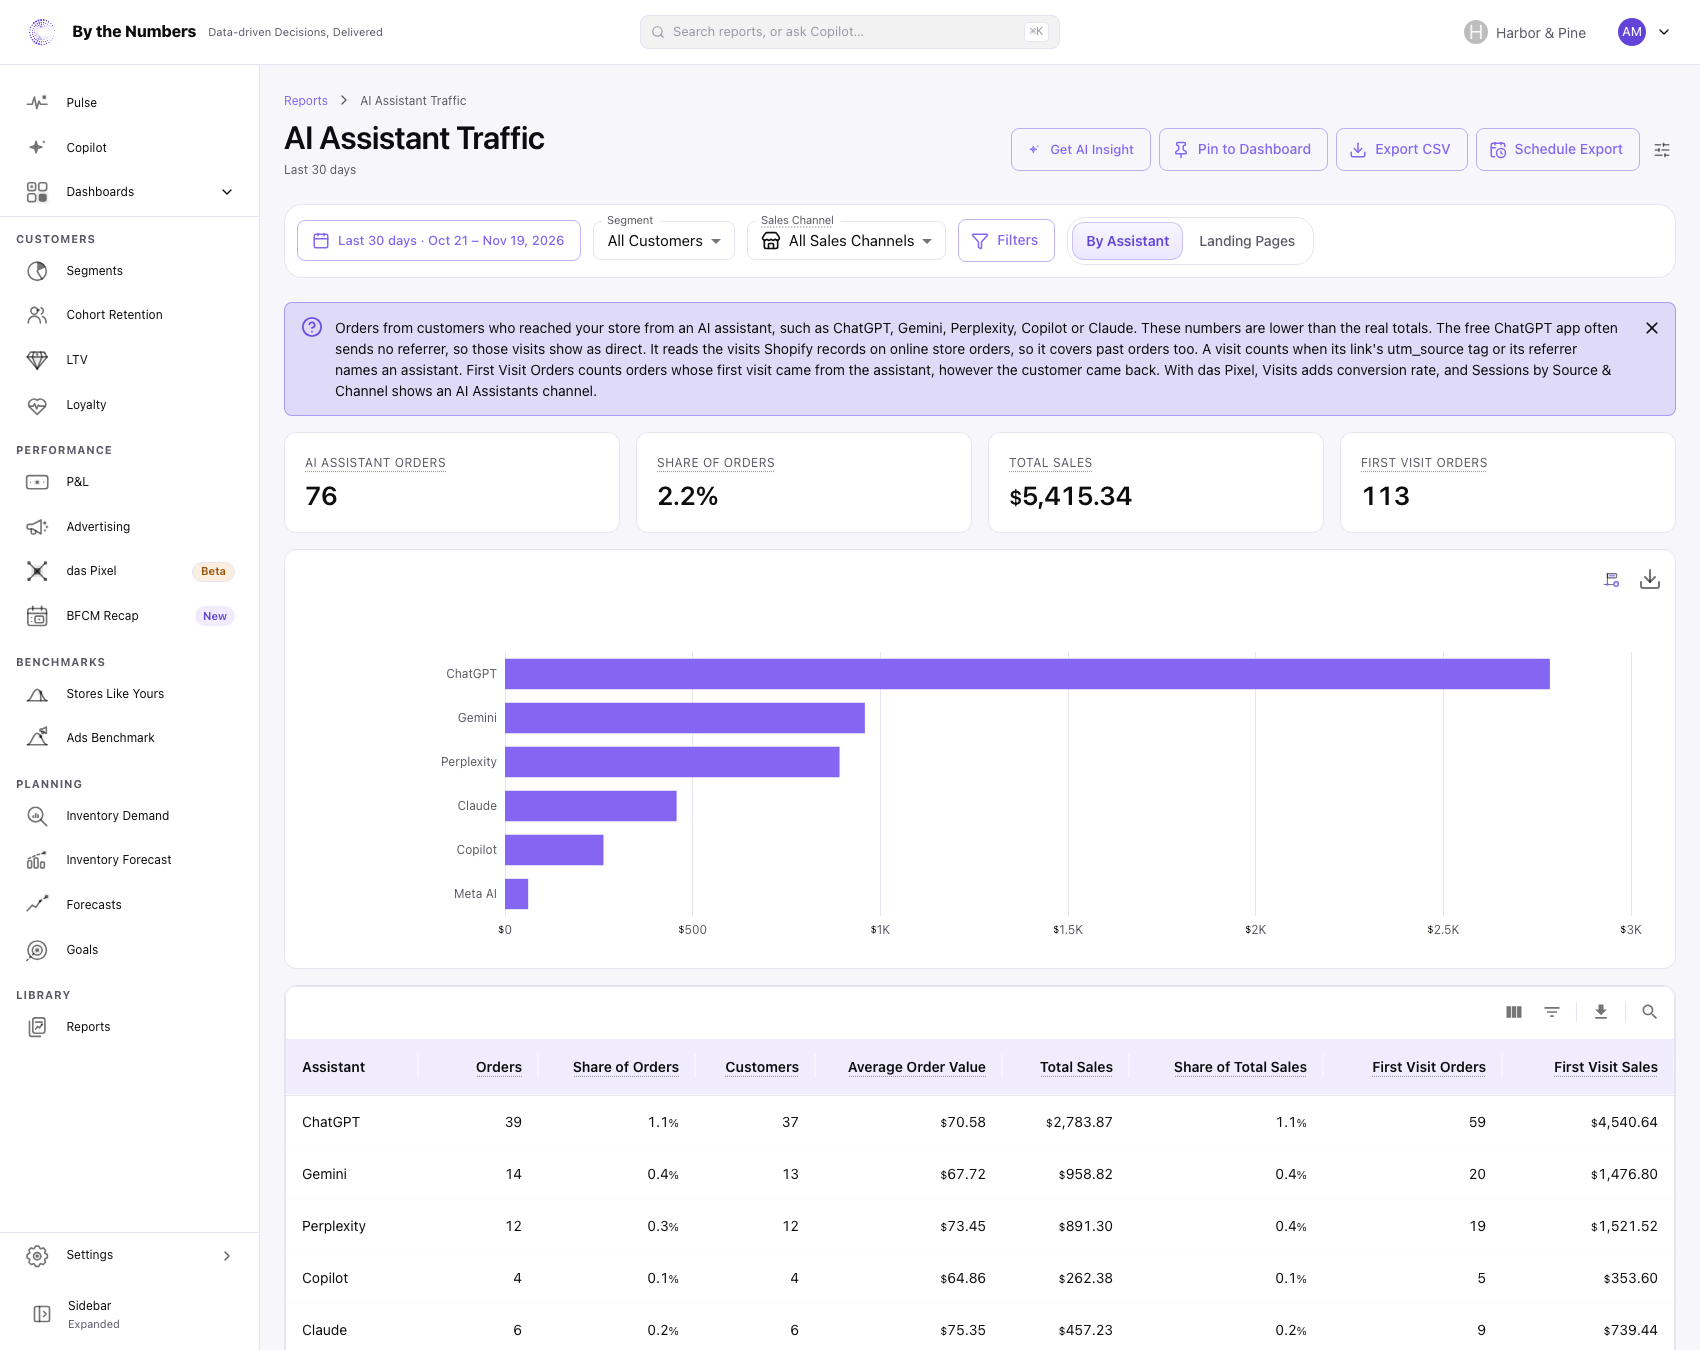
These numbers are lower than the real totals. The free ChatGPT app often sends no referrer, so those visits show as direct in every report and are missing here.
How It’s Calculated
The report reads the visits Shopify records on your online store orders. It works with or without das Pixel, and it covers past orders too.
Sales by Marketing Referral Source reads the same record.
Which Visits Count
A visit counts as an assistant’s when the first of these names it:
- The
utm_sourcetag. ChatGPT addsutm_source=chatgpt.comto the links it shows. - The referrer. That is the site or app the visit came from.
- Shopify’s own name for the visit’s source.
A tag wins over the referrer, because it says where the link was posted. A value names an assistant when it is one of the assistant’s names, such as chatgpt or perplexity. It also names one when it is a site or app of the assistant, such as gemini.google.com or claude.ai, or a subdomain of one.
The report knows 8 assistants: ChatGPT, Gemini, Perplexity, Copilot, Claude, Meta AI, Grok and DeepSeek. It can’t tell why an assistant named your store.
The Views
The View tabs switch between 3 views:
- By Assistant: one row for each assistant, in the order listed above. An assistant with no orders and no first visits in the range isn’t listed.
- Landing Pages: one row for each assistant and the page its visit landed on, with the most orders first. It lists the 200 rows with the most orders. A visit with no recorded page shows as
(unknown). - Visits: das Pixel’s visits from each assistant. The tab appears only when das Pixel is installed. It reads the
utm_sourcetag, then the site or app the visit came from.
Assistant Columns
- Assistant: the assistant that sent the visit.
- Orders: orders placed in a visit from the assistant. That is the visit the order was placed in, or the last one before it.
- Share of Orders: the assistant’s orders divided by all your store’s orders in the range, with the same filters.
- Customers: the number of different customers who placed those orders. Each order with no customer counts as 1.
- Average Order Value: the assistant’s sales before returns, divided by its orders.
- Total Sales: counted as in Sales by Marketing Referral Source.
- Share of Total Sales: the assistant’s Total Sales divided by your store’s Total Sales in the range, with the same filters.
- First Visit Orders: orders whose first recorded visit came from the assistant, however the customer came back to buy.
- First Visit Sales: the Total Sales of those orders.
A share is blank when your Total Sales for the range is zero or less. First Visit Orders can be higher than Orders. That means the assistant introduced customers who bought later through another route.
Landing Pages has Landing Page, Assistant, Orders, Customers, Average Order Value and Total Sales.
Visits Columns
- Visits: the visits das Pixel saw that started from the assistant.
- Share of Visits: its visits divided by every visit das Pixel saw on your store in the range.
- Visitors: the number of different browsers.
- Conversions: the number of visits that ended in a purchase.
- Conversion Rate: Conversions divided by Visits.
- Revenue: the value of those purchases, from the Shopify order each one links to.
- Order Linked: the share of conversions that matched a Shopify order. A low figure means more of the revenue comes from the checkout value.
Visitors aren’t added up across assistants, because one visitor can come through 2 of them. Order Match Rate is weighted by conversions.
Summary Cards and Chart
On By Assistant, the cards are AI Assistant Orders, Share of Orders, Total Sales and First Visit Orders. Landing Pages shows AI Assistant Orders and Total Sales. Visits shows AI Assistant Visits, Share of Visits, Conversion Rate, Revenue and Order Match Rate.
The chart shows Total Sales for each assistant, or the 10 landing pages with the most Total Sales. On Visits it shows Revenue.
What Counts
- Only online store orders have a recorded visit. Point of sale, phone, draft and marketplace orders aren’t in any row.
- By the Numbers needs permission to read Shopify’s marketing events. Without it the report says Not available for this store.
- Segment, Sales Channel and Filters narrow By Assistant and Landing Pages. Visits has none of them, and there’s no comparison period.
- Visits starts from the day das Pixel was connected, since it can’t fill in earlier visits.
- A warning shows above Visits when das Pixel saw less than 70% of your online-store orders in the last 30 days.
What Good Looks Like
There’s no target. Treat the figures as the least that came from assistants, since some visits can’t be told apart from direct ones.
Compare First Visit Orders with Orders. A high first-visit count means assistants are where customers first meet your store, even when the sale closes elsewhere.
What to Do About It
- Few or no orders: check the
directrow in Sales by Marketing Referral Source. Some assistant visits hide there. - A landing page with many orders: that is a page assistants send customers to. See how it does for all traffic in Revenue by Landing Page.
- A low Conversion Rate on Visits: open Sessions Explorer with the Channel filter set to AI Assistants, and read what those visitors did.
Get AI Insight at the top of the report asks Copilot for a short read of it.
Where to Find It
- AI Assistant Traffic: open Reports and look under Marketing.
- Sessions by Source & Channel: with das Pixel, an AI Assistants channel holds the same visits.
- Sales by Marketing Referral Source: sales by Shopify’s referral source.