Profit by Vendor
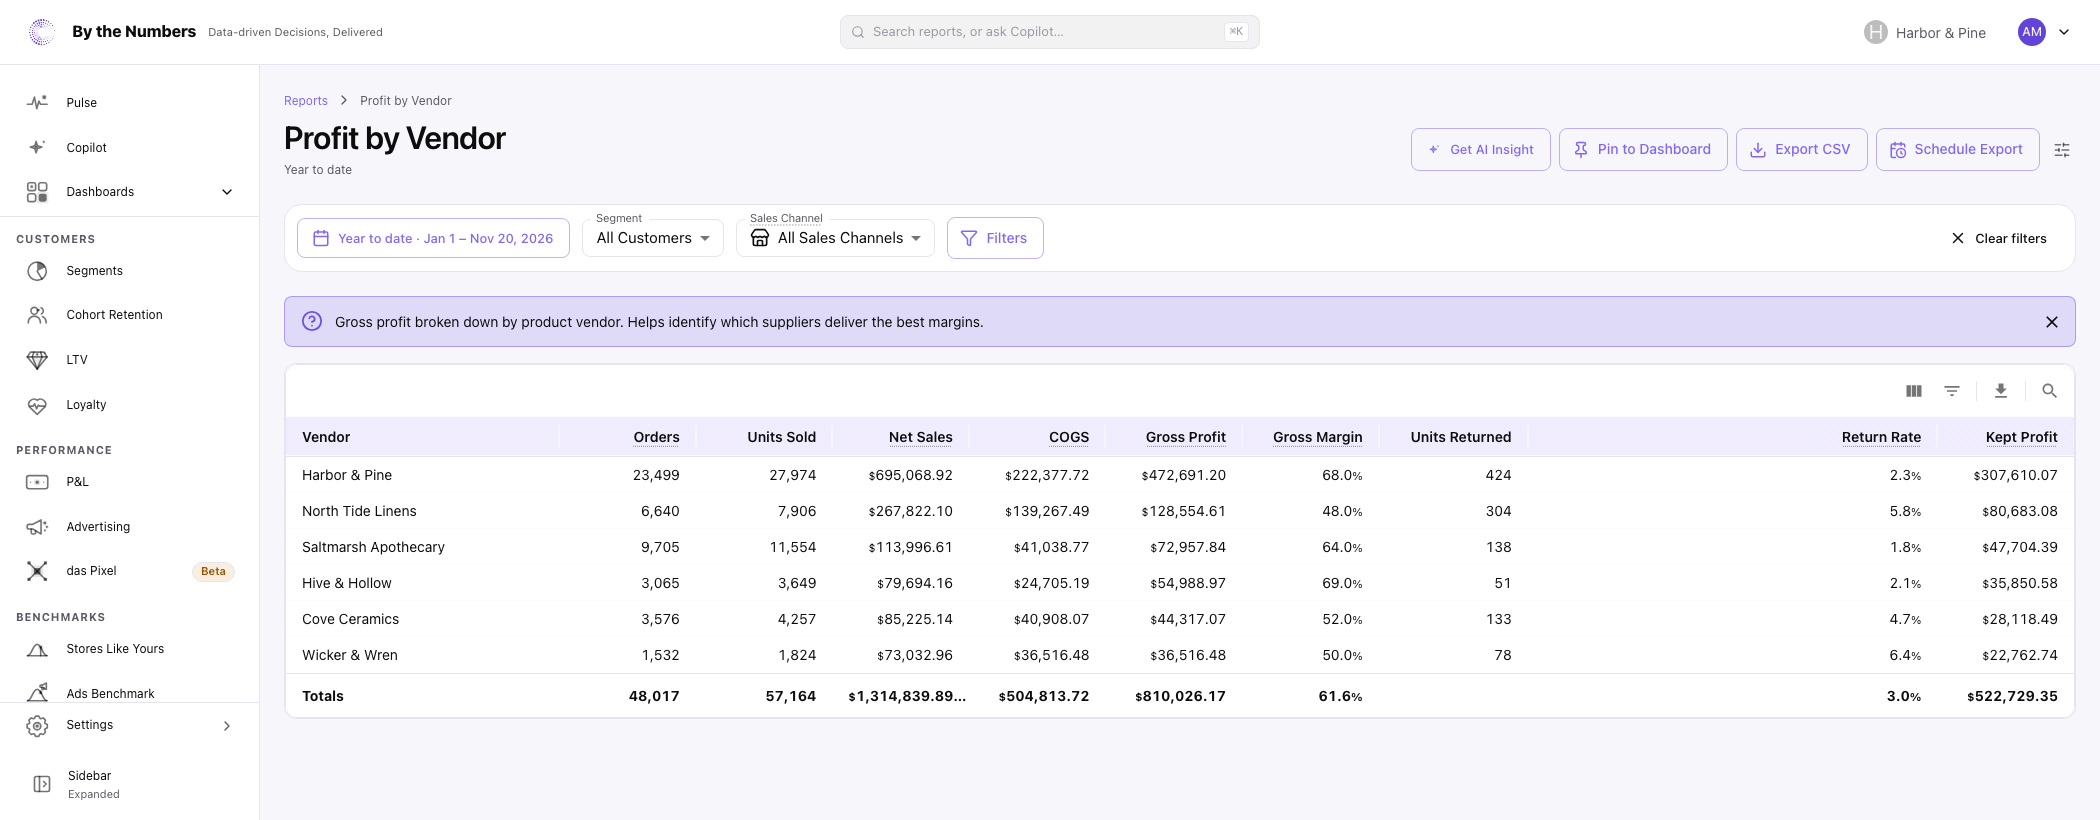
Profit by Vendor shows the gross profit each vendor’s products brought in, after the cost of the goods sold.
How It’s Calculated
The report is a table with one row per vendor. Rows are listed with the most gross profit first, up to 500 vendors.
The vendor is the one recorded on each order line. Lines with no vendor are grouped as Unknown.
The columns are:
- Vendor: the vendor of the items sold.
- Orders: the number of orders that included the vendor’s items.
- Units Sold: the number of units sold.
- Item Net Sales: what the items sold for, after discounts: price times quantity, less the discount on that line. It leaves out returns, shipping and tax.
- COGS: the cost of the goods sold, worked out as quantity × unit cost.
- Item Gross Profit: Item Net Sales less COGS.
- Item Gross Margin: Item Gross Profit as a share of Item Net Sales.
- Units Returned, Return Rate and Item Kept Profit: the effect of returns, explained below.
A totals row under the table counts each order and line once, rather than adding up the vendor rows. Show totals row in the Report settings menu turns it on or off for every report. An order with items from several vendors counts in each vendor’s Orders, so the Orders column can add up to more than the totals row.
Item Net Sales here means something different from Net Sales in Total Sales. This one is only items less discounts. Item Gross Profit isn’t reduced by returns, and shipping and tax aren’t part of it.
Unit Costs
COGS uses each product variant’s Cost per item from Shopify. It uses the cost set today, not the cost when the order was placed.
A unit whose variant has no cost counts as zero cost, so Item Gross Profit and Item Gross Margin are too high where costs are missing. This report has no Cost Coverage column. Unit Cost Coverage shows what’s missing.
Returns Columns
Returns take time to arrive, so these 3 columns count only orders placed more than 90 days ago:
- Units Returned: units refunded, counted against the order they came from, not the day of the refund.
- Return Rate: Units Returned as a share of units sold on those orders. A dash means fewer than 20 units, too few for a rate. It doesn’t mean no returns.
- Item Kept Profit: the profit on the units customers kept: each line’s net sales less its cost, weighted by the share of its units not returned.
Order lines that don’t record whether they were returned are left out too.
For a date range inside the last 90 days, Units Returned and Item Kept Profit show 0 and Return Rate shows a dash. For a longer range, they cover only the older orders, so don’t compare Item Kept Profit with Item Gross Profit in the same row.
What Counts
- Orders count on the day they were processed, in your store’s time zone.
- Canceled orders, and orders whose payment was voided or expired, are left out.
- Sales Channel, Segment and Filters narrow the report. There’s no comparison period.
What Good Looks Like
Compare vendors with each other and with their own past. A vendor is doing well when its share of your gross profit is at least as large as its share of your units.
- Item Gross Margin is steady. A margin that slips points to a cost increase from the vendor, or heavier discounting on its products.
- Return Rate is low. A vendor with a high return rate takes back the profit its row shows.
What to Do About It
- Renegotiate with low-margin vendors. Ask for better unit costs, then update Cost per item in Shopify so this report shows the change.
- Order more from the vendors that keep the most. Weigh gross profit and return rate together.
- Check the cost data. Vendors with missing costs look more profitable than they are. Unit Cost Coverage lists what’s missing.
Get AI Insight at the top of the report asks Copilot for a short read of it.
Where to Find It
- Profit by Vendor: open Reports and look under Profitability.
- Profit by Product: the same breakdown by product.
- Profit & Margin: gross profit and margin over time.