First- vs Last-Touch Attribution to Revenue
First- vs Last-Touch Attribution to Revenue credits each purchase twice. One credit goes to the channel that first brought the visitor, and one to the last channel that sent them before they bought.
How It’s Calculated
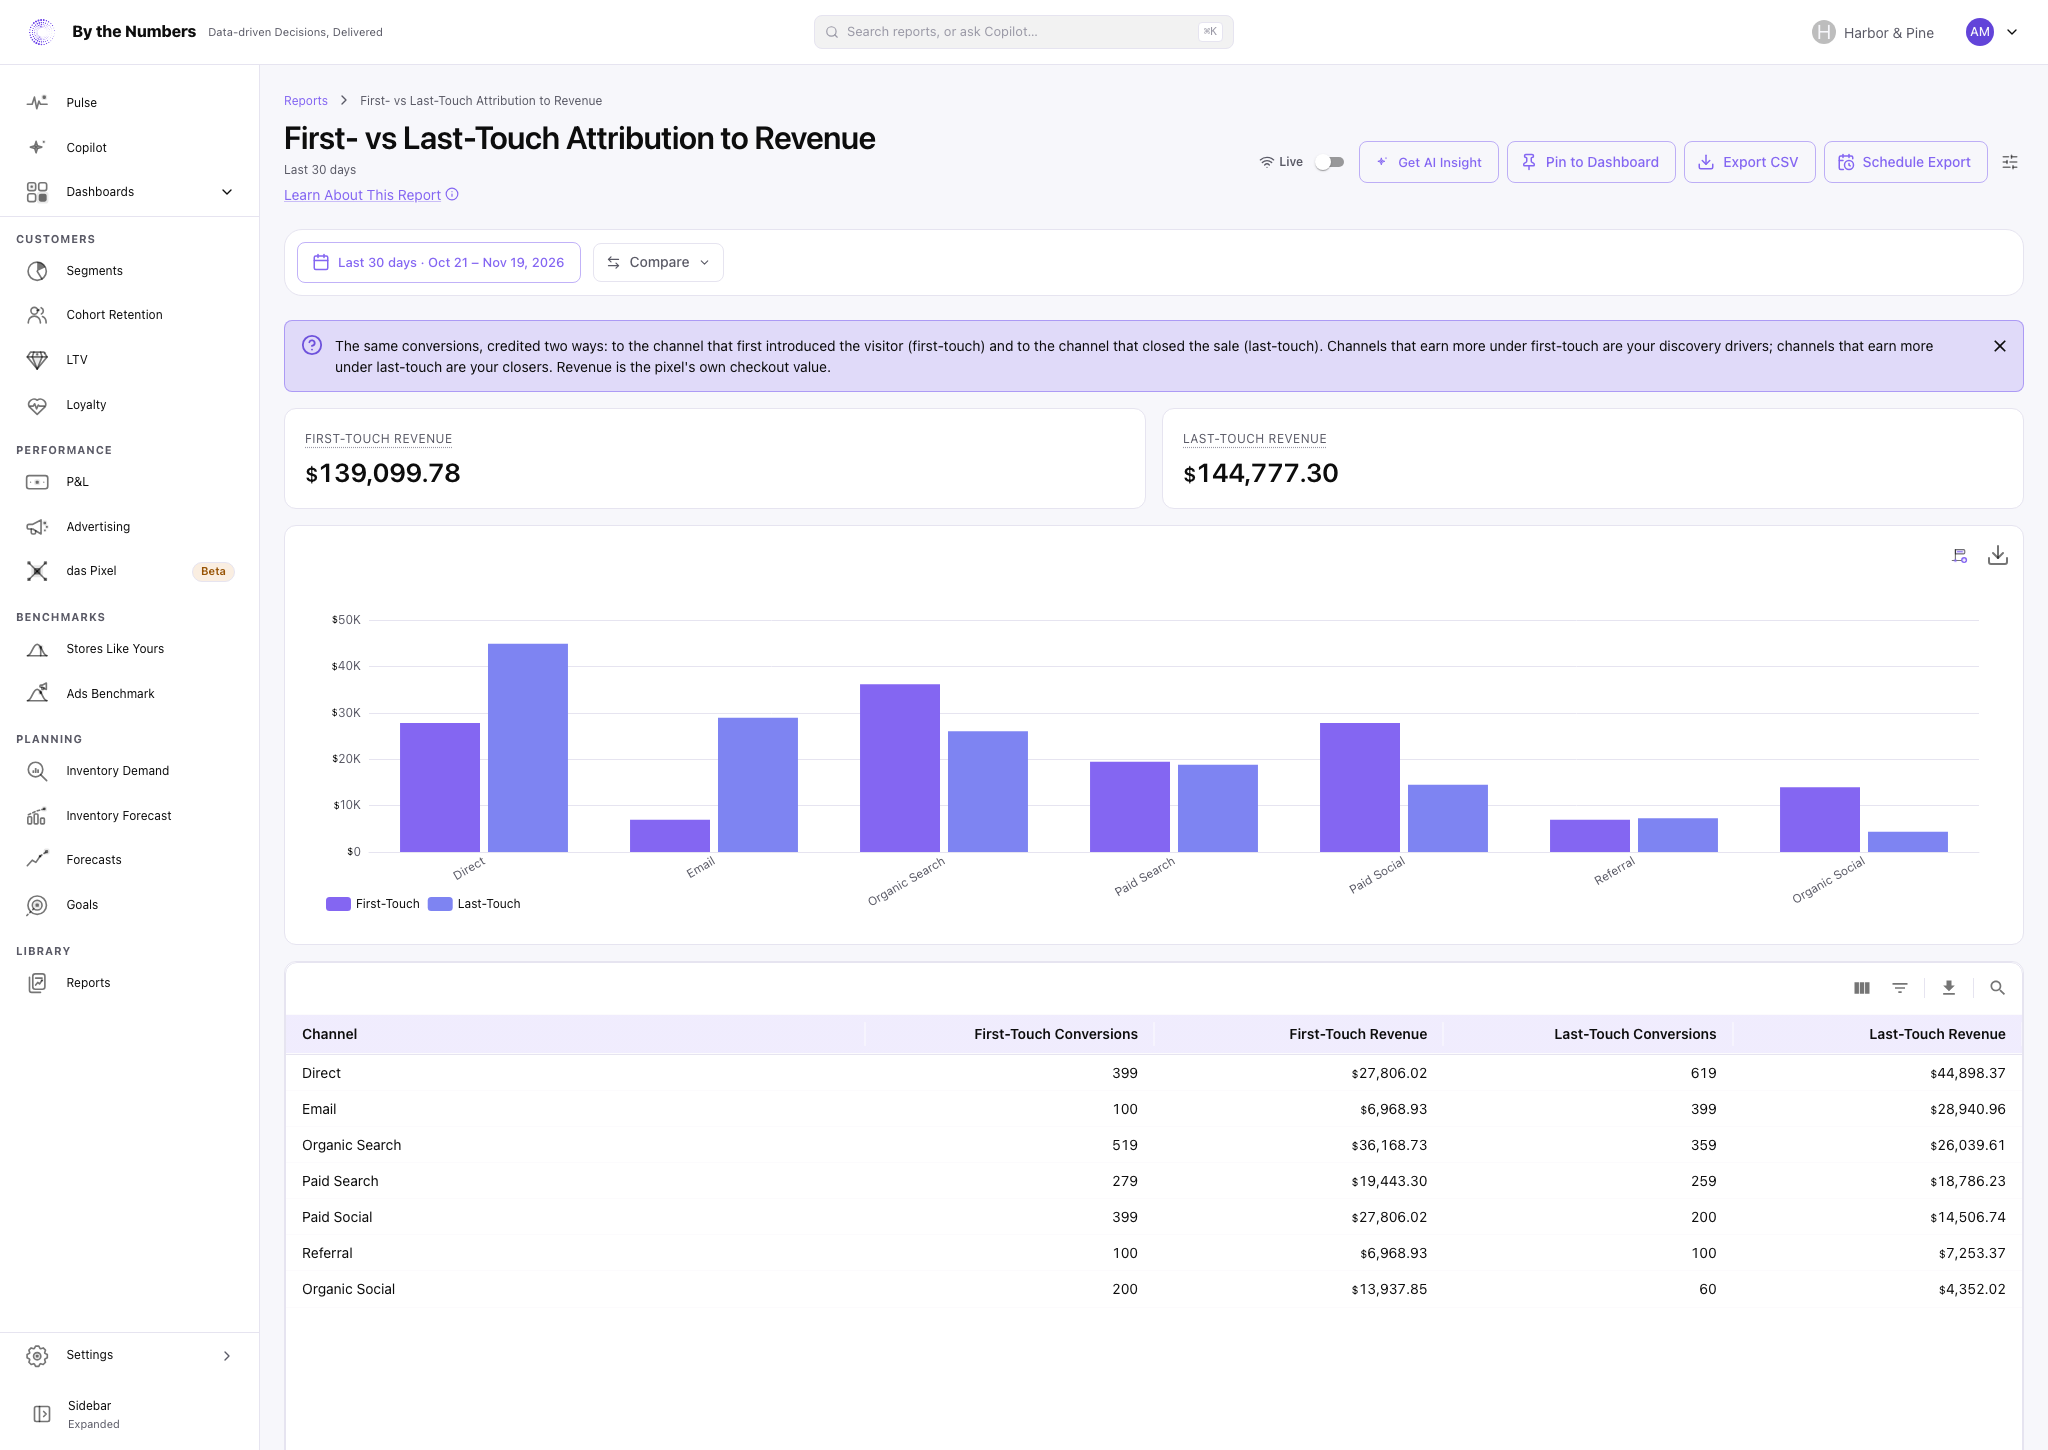
Each row is one channel, with the most Last-Touch Revenue first. The columns are:
- Channel: the channel.
- First-Touch Conversions and First-Touch Revenue: the purchases credited to the channel of the visitor’s first event, and their value.
- Last-Touch Conversions and Last-Touch Revenue: the purchases credited to the channel of the visitor’s last touch before the purchase, and their value.
For each purchase das Pixel looks at the events from the same browser, or from the same logged-in customer, up to the purchase. The first touch is the earliest of those events.
The last touch is the latest of those events that is a touch and happened in the 30 days before the purchase. An event is a touch when it has an ad click ID, a UTM tag or an outside referrer, which is a link from another website. A purchase with no touch in those 30 days is credited to Direct.
Your own pages aren’t a touch. Moving around your store sends your own address as the referrer, and returning from a payment page such as Klarna sends theirs. Pages from Shopify, and checkout pages, don’t count either.
For the first touch, only events from the 30 days before the start of your date range onward are considered. A visitor whose real first visit was earlier is credited to the earliest event in that window.
Each touch is sorted into a channel by the rules in Sessions by Source & Channel. One thing differs: a touch with no UTM tags and no ad click, but an outside referrer, is sorted by that referrer:
- Email: Gmail on the web or in its Android app, Outlook or Yahoo Mail.
- Organic Search: Google, Bing, DuckDuckGo, Yahoo, Baidu, Ecosia, Qwant, Startpage, Yandex, Brave, Naver, Seznam or Ask.
- Organic Social: Facebook, Instagram, X or Twitter, LinkedIn, Pinterest, YouTube, TikTok, Reddit, Snapchat, Threads, WhatsApp, Telegram, Discord, Tumblr, VK or Quora.
- Referral: any other website.
Sessions by Source & Channel still files these visits under Direct.
A purchase is counted once per channel under each model. The 2 sets of figures add up to the same purchases.
Revenue here is the value das Pixel saw at checkout: the total price, with shipping and tax, before refunds. It isn’t the Shopify order’s value, so it can differ from the Revenue in other Web Analytics reports.
For credit to the ad click, use das Pixel Attribution.
Summary Cards
The cards above the table are First-Touch Revenue and Last-Touch Revenue. They add up the rows. With Compare on, each card shows its change.
A bar chart above the table compares First-Touch and Last-Touch revenue for the 8 channels with the most Last-Touch Revenue. A pinned dashboard card shows the same chart.
What Counts
- Visitors who declined analytics cookies, or who opted out of the sale or sharing of their data while Require Sale-of-Data Consent is on, aren’t recorded. Known bots are left out.
- A UTM tag, click ID or referrer is recorded only with the visitor’s marketing consent and Track Marketing on. Without them, the visit has no touch.
- Only purchases inside the date range count, in your store’s time zone.
- Turn on Live to refresh the report every 30 seconds. Without it, a figure can be up to 10 minutes old.
A warning shows above the report when das Pixel saw less than 70% of your online-store orders in the last 30 days. This report has no Segment, Sales Channel or Filters control.
What Good Looks Like
There’s no target. A channel with more First-Touch Revenue than Last-Touch Revenue brings visitors in. A channel with more Last-Touch Revenue closes sales.
Read the 2 columns together, not alone. Neither shows what caused the sale.
What to Do About It
- A channel strong on First-Touch Revenue: keep funding it, even if it isn’t the channel that closes.
- A large Direct share on first touch: tag your links, so Sessions by Source & Channel can name the channel.
- Revenue that doesn’t match your Shopify reports: see Pixel vs Shopify Attribution for how many purchases das Pixel matched to an order.
Get AI Insight at the top of the report asks Copilot for a short read of it.
Where to Find It
- First- vs Last-Touch Attribution to Revenue: open Reports and look under Web Analytics. It appears there once das Pixel is connected.