Time-of-Day × Day-of-Week
Time-of-Day × Day-of-Week shows when visitors start sessions on your store, by hour and weekday, so you can see your busiest times.
How It’s Calculated
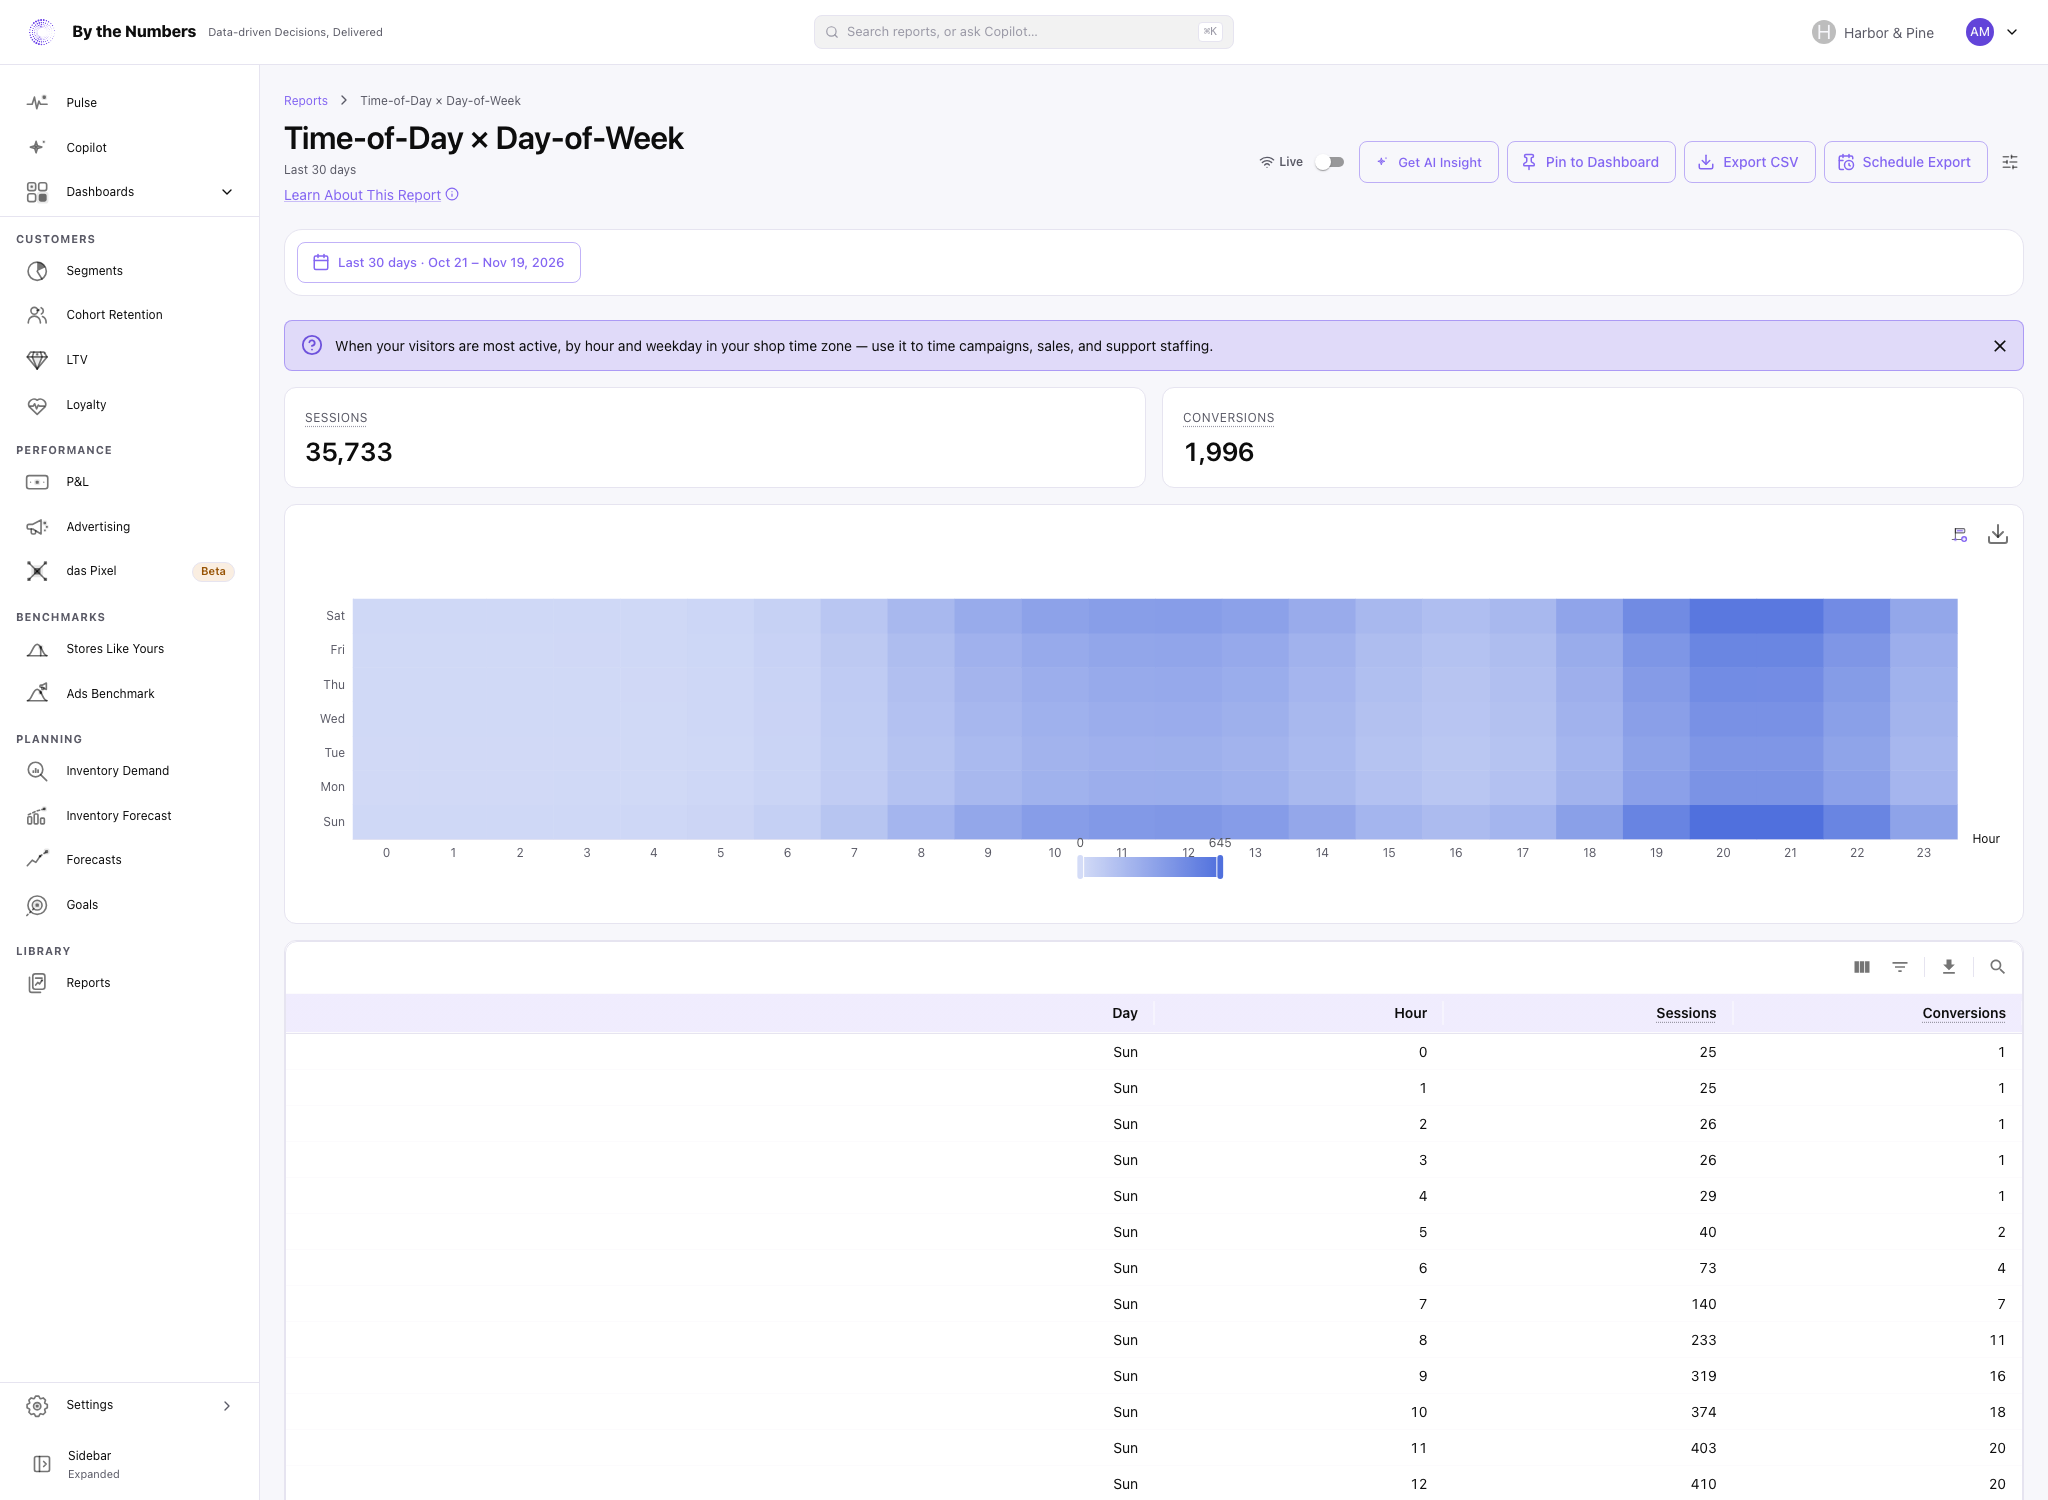
The two cards above the heatmap are Sessions and Conversions. They add up every hour and weekday in the date range.
The heatmap has a square for each weekday and hour. Weekdays run from Sun at the bottom to Sat at the top, and hours run from 0 to 23 across the top.
A darker square means more sessions started in that hour. Point at a square to see its weekday, hour and number of sessions.
The table under the heatmap has one row for each weekday and hour that had a session. The columns are:
- Day: the weekday.
- Hour: the hour of the day, from 0 to 23. Hour 14 covers 14:00 to 14:59.
- Sessions: sessions that started in that hour.
- Conversions: the number of those sessions that ended in a purchase.
A session counts in the hour and weekday it started. Hours follow your store’s time zone, so a visitor in another time zone counts at your store’s local time.
The report adds up every day in the date range. It doesn’t average them.
A range with 5 Mondays and 4 Tuesdays shows more sessions on Mondays for that reason alone. Use a range of whole weeks to compare weekdays fairly.
What Counts
- Visitors who declined analytics cookies, or who opted out of the sale or sharing of their data while Require Sale-of-Data Consent is on, aren’t recorded. Known bots are left out.
- Only events inside the date range count.
- Turn on Live to refresh the report every 30 seconds. Without it, a figure can be up to 10 minutes old.
This report has no Compare, Segment, Sales Channel or Filters control. Its only filter is the date range.
What Good Looks Like
There’s no target. Look for the squares that stand out, and for hours where sessions are high but Conversions are low.
A range of a few days shows too few sessions to read a pattern. Use at least 4 weeks.
What to Do About It
- A busy hour: schedule emails, posts and ad budgets to land just before it.
- A busy hour with few conversions: check what visitors see then, such as a slow site or an offer that has ended.
- A quiet hour with conversions: consider whether a paid campaign could use it.
Get AI Insight at the top of the report asks Copilot for a short read of it.
Where to Find It
- Time-of-Day × Day-of-Week: open Reports and look under Web Analytics.