Customer Loyalty
Customer Loyalty sorts every customer who has ordered into one of 7 loyalty groups. Each group is based on how many orders a customer has placed and how long ago their last order was.
How It’s Calculated
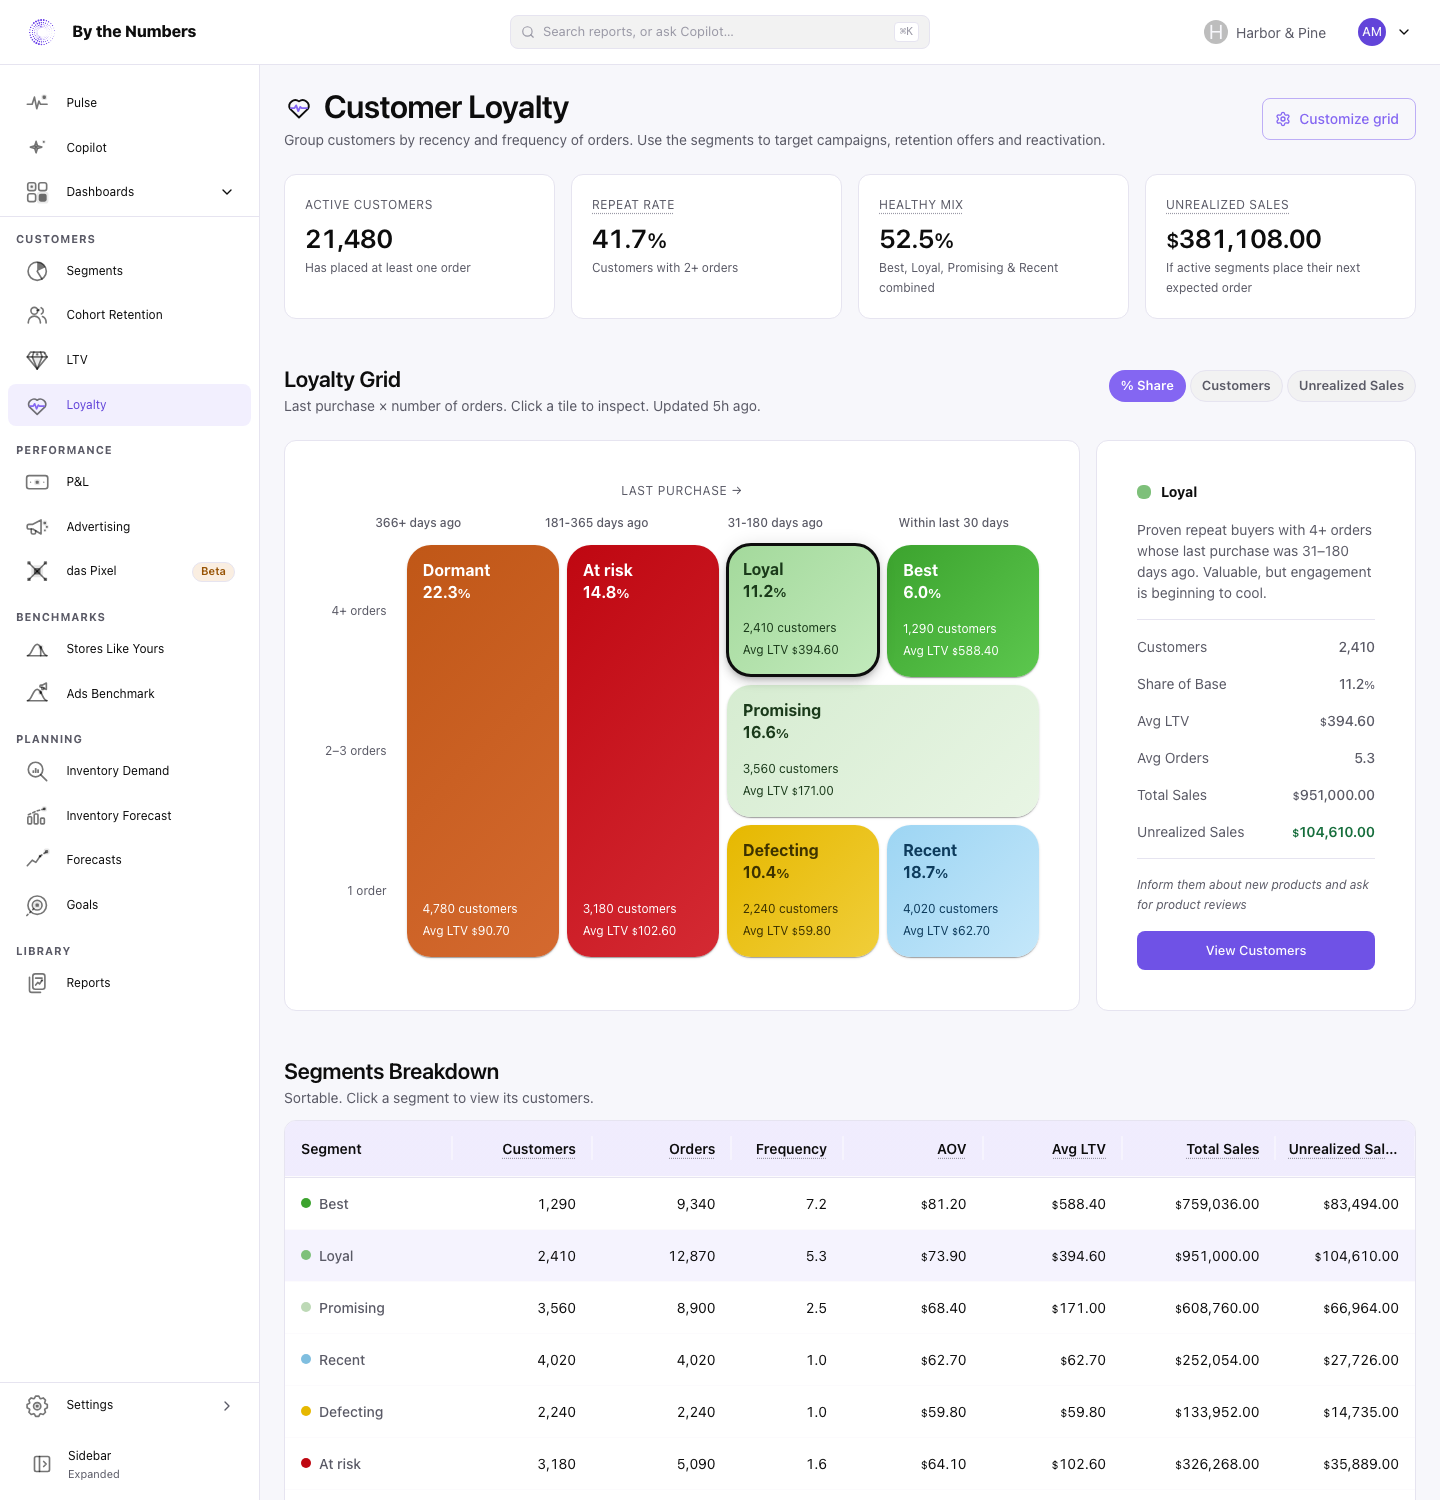
The Loyalty Grid has 4 columns for how long ago a customer’s last order was, and 3 rows for how many orders they’ve placed. With the General / Default cutoffs, the groups are:
| Group | Orders | Last order |
|---|---|---|
| Best | 4 or more | In the last 30 days |
| Loyal | 4 or more | 31–180 days ago |
| Promising | 2–3 | In the last 180 days |
| Recent | 1 | In the last 30 days |
| Defecting | 1 | 31–180 days ago |
| At risk | Any | 181–365 days ago |
| Dormant | Any | More than 365 days ago |
Orders that were canceled, or whose payment was voided or expired, don’t count. Customers with no orders aren’t in any group.
The cards above the grid sum up your whole customer base:
- Active Customers: customers who have placed at least one order, Dormant ones included.
- Repeat Rate: the share of those customers with 2 or more orders.
- Healthy Mix: the share in Best, Loyal, Promising and Recent combined.
- Unrealized Sales: what your customers are still expected to spend. It’s their predicted lifetime value minus what they’ve spent so far.
Use the % Share, Customers and Unrealized Sales buttons to change what each tile shows. Click a tile to see that group’s customers, share of your base, average lifetime value, average orders, Total Sales and Unrealized Sales. The Segments Breakdown table compares every group by customers, orders, frequency, AOV, average lifetime value, Total Sales and Unrealized Sales.
Order counts and days since the last order are worked out each time your customer data refreshes, not as each order comes in. The Updated note above the grid says when that last happened.
Cutoffs for New Stores
A store that installs By the Numbers starts on General / Default. Until anyone saves the loyalty settings, By the Numbers then fits the cutoffs to the store in 2 steps:
- When it works out your Store Category from your storefront, it switches to that category’s preset. Other categories stay on General / Default.
- Fashion / Apparel: Clothing, Men’s Clothing, Children’s Clothing, Swim, Sleep & Lingerie, Shoes & Accessories, and Apparel under Sports and Recreation
- Consumables / Replenishment: Coffee & Tea, Pet Food, Healthfood & Supplements, and Groceries
- High-Ticket / Durable Goods: Decor & Furniture, Outdoor Luxury, and Mobility Devices
- Seasonal: Jewelry and Accessories, Candles, Fragrances, and Toys & Games
- When your first import finishes, it fits the 3 day cutoffs to how soon your customers come back.
For step 2, it takes the median number of days between a customer’s first and second order. It counts customers whose first order was 1–3 years ago and who ordered again on a later day, within a year. The day cutoffs are 1, 2.5 and 5 times that median, kept to at least 14, 30 and 60 days and at most 365, 730 and 1,095 days.
Those are then blended with the preset’s day cutoffs, by how many such customers your store has. With 25, the result is halfway between the two; with 250, it’s mostly your store’s. A store with less than a year of orders has none of them, so it stays on the preset.
When the result differs from the preset, Customize grid shows the preset as Custom.
If you change your Store Category on the Business Profile page before anyone saves the loyalty settings, the cutoffs follow it. Each change is listed in the Audit Log as Automatic, with the reason.
Once anyone saves the loyalty settings, even without changing anything, By the Numbers never changes them again. Stores that installed By the Numbers before October 2026 keep the cutoffs they have.
Tune Your Loyalty Groups
Some stores that installed before October 2026 see a banner called Tune Your Loyalty Groups below the summary cards. By the Numbers is switching it on store by store. It appears when the cutoffs Suggest thresholds would give differ from yours enough to move at least 10 customers, and 2% of your customers, into another group.
It offers cutoffs fitted to your store’s own buying cycle. It offers your Store Category’s preset only if nobody has saved your loyalty settings and you are still on the General / Default cutoffs. It never offers the General / Default cutoffs, and it never offers a preset over cutoffs you chose.
Click Review Suggestion to open the Tune Loyalty Groups window. It shows:
- How many customers would change group, what share of your customers that is, and the groups that change most.
- Where the suggestion came from: your store’s buying cycle, the preset for your Store Category, or the General / Default preset. A closed section under it gives the detail.
- How many customers each group would have before and after, with one bar for each group’s net change.
- Each day cutoff now and suggested, on a line of days since last order, with an example day for each cutoff that moves. The order-count cutoffs sit below it.
- The segment syncs, dashboard cards and filters, forecasts and scheduled exports that use your loyalty groups, and any custom segments that filter on a loyalty group. Scheduled exports are listed only for teammates who can export data. They stay as they are and follow the groups, so who is in them changes.
- Exact Numbers, a closed section with the full tables.
Nothing changes until you click Apply Suggested Cutoffs. Applying saves the cutoffs the way Customize grid does, keeps your group names and shows in the Audit Log with you as the person who made the change. The recalculation takes 2–3 minutes.
If your store’s numbers change while the window is open, By the Numbers refuses the save and shows the updated suggestion. Nothing is saved until you click Apply Suggested Cutoffs again. If the updated suggestion would move no one, the window says your groups already fit your store.
Not Now closes the window and keeps the banner. Don’t Show Again hides the banner for everyone on the account.
It comes back when the suggestion moves a day cutoff by more than a quarter, or changes the order cutoffs. You can also bring it back from the Dismissed tab in Preferences, where it is listed as Tune Loyalty Groups to Your Store.
Change the Cutoffs
General / Default fits poorly if people rebuy what you sell every month, or only once every few years. To change the cutoffs:
- Click Customize grid.
- Pick the Preset closest to your store: General / Default, Consumables / Replenishment, Fashion / Apparel, High-Ticket / Durable Goods or Seasonal.
- To set your own cutoffs, pick Custom and edit the day and order boundaries. Suggest thresholds proposes cutoffs for your store and switches the preset to Custom.
- Rename any group under Segment labels, if you like.
- Click Save.
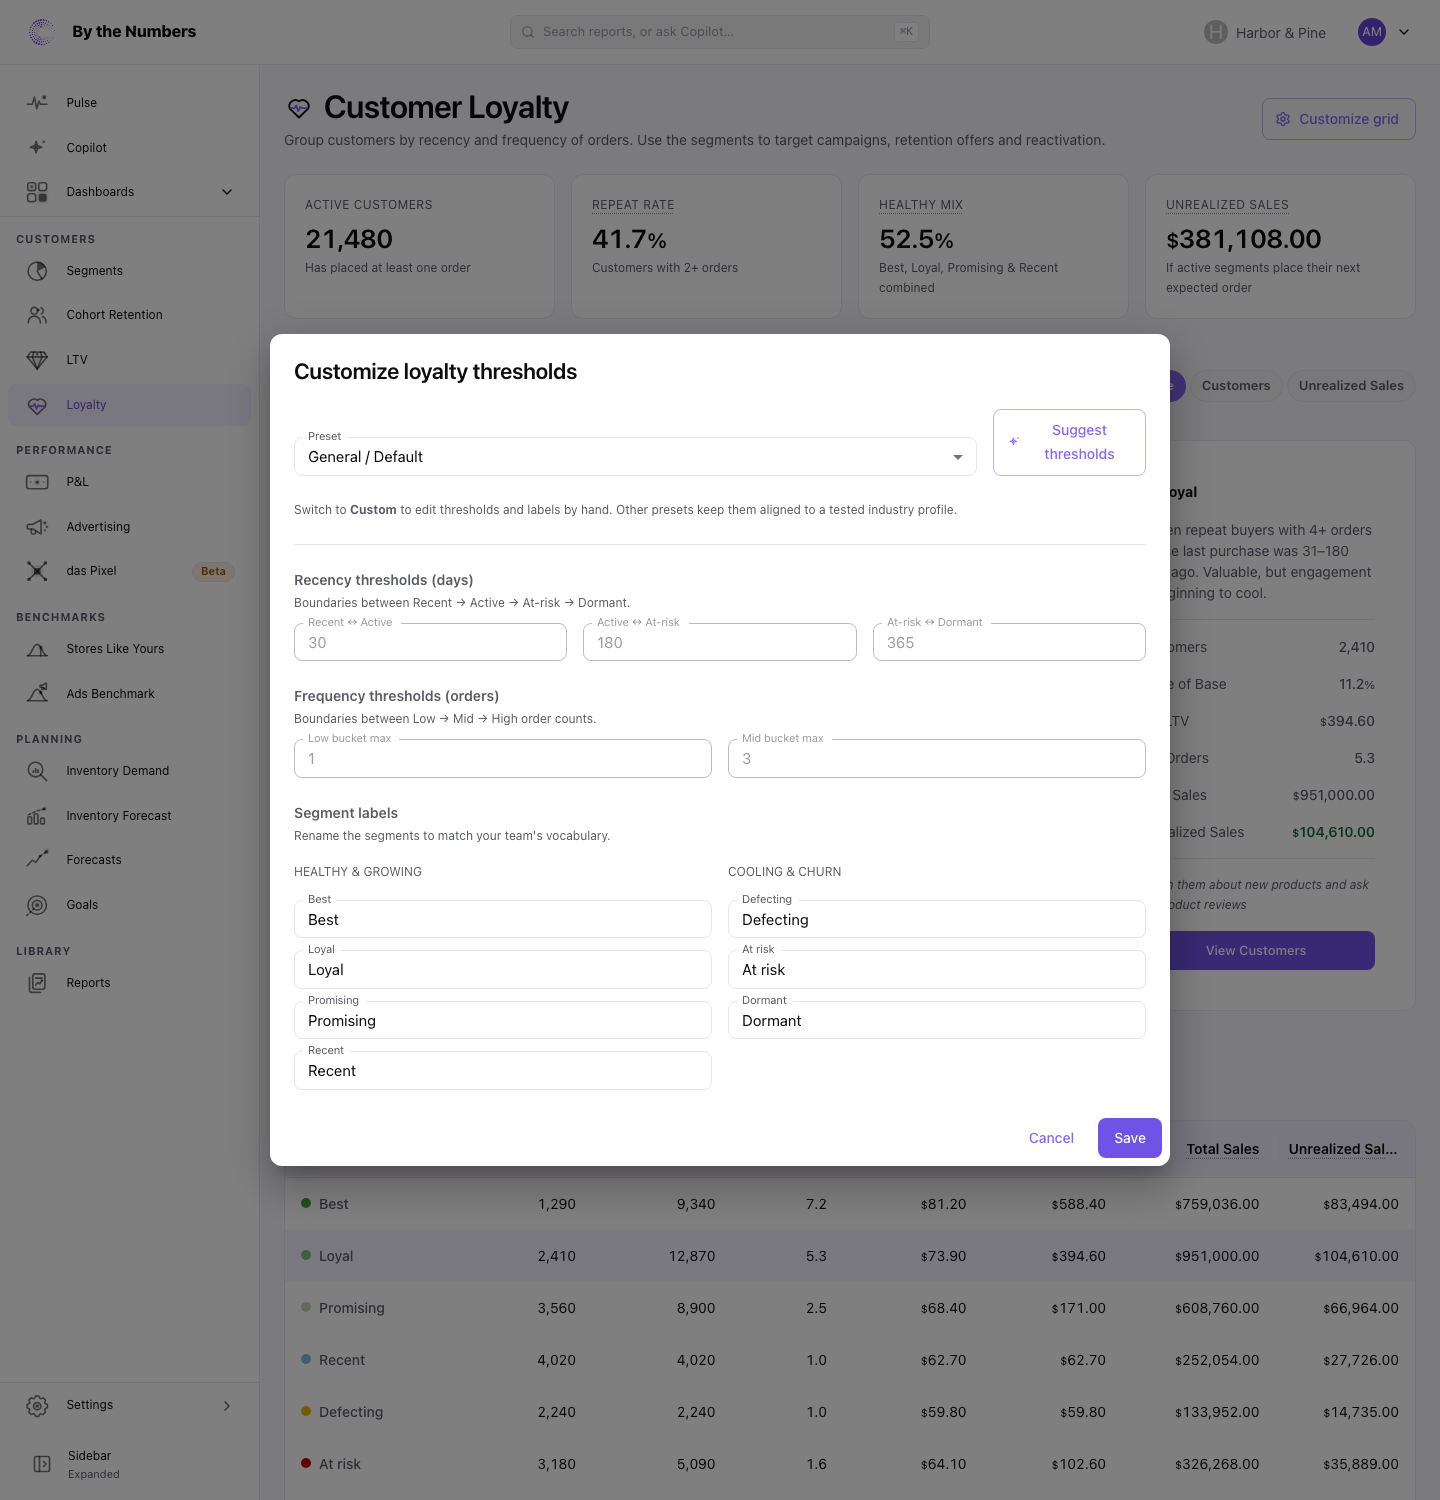
Suggest thresholds fits the day cutoffs the way a new store’s are fitted. It starts from the median days between a customer’s first and second order, which By the Numbers works out every night. That needs at least 30 customers whose first order was 1–3 years ago and who ordered again on a later day, within a year.
Your store also needs a Store Category and an average of at least 10 orders a month. A store that misses any of these gets its category’s preset instead, or General / Default when the category has none. The order boundaries are always the preset’s.
A note under the preset says which of the three you got:
- Suggested from your store’s buying cycle. The day cutoffs are fitted to your own customers.
- Suggested from the industry preset. By the Numbers can’t measure your store’s buying cycle yet, so these are the standard cutoffs for your Store Category.
- Suggested from the default preset. By the Numbers can’t measure your store’s buying cycle yet. Your Store Category has no preset of its own, or none is set. So these are the General / Default cutoffs.
The group counts change as soon as you save. Avg LTV, Unrealized Sales and the loyalty group segments on Customer Segments catch up once the recalculation finishes, which usually takes 2–3 minutes.
Turn on Keep Serial Returners Out of Best in the same dialog to move customers who also match the Serial Returners segment from Best to Loyal. Customers with no return data yet stay where they are.
What Good Looks Like
A healthy store keeps a steady stream of Recent customers coming in, and moves a growing share of them up into Promising, Loyal and Best. The Healthy Mix card tracks how many customers sit in those groups.
What counts as healthy depends on how often your product needs replacing. A store selling something people use up each month should have far more customers in Best than one selling furniture. Set the cutoffs to match your buying cycle first, or the grid makes your store look better or worse than it is.
Don’t be alarmed by a large At risk and Dormant base, or a low Healthy Mix. Watch the direction instead. Note your Healthy Mix each month: if it rises, a larger share of your customers are still buying.
In each of 17 sampled stores using By the Numbers, At risk and Dormant held over half the customers who had ordered. The Healthy Mix was under 25% in 14 of them.
What to Do About It
Each group’s panel suggests an action. Click View Customers to open the group’s segment, then sync it to your email or ad platform:
- Best: reward them with early access, a VIP or loyalty program and review requests. Leave them out of discounts they don’t need.
- Loyal: keep in touch with new products and personal outreach before they cool further.
- Promising: a targeted offer or loyalty reward can turn them into 4-order customers.
- Recent: send a thank-you soon after the first order, with a reason to come back.
- Defecting: run a win-back campaign while they still remember you.
- At risk: send a strong offer or personal reminder.
- Dormant: a low-cost reactivation email. If they don’t respond, leave them out of paid ad audiences.
Where to Find It
- Customer Loyalty: Loyalty in the navigation, under Customers.
- Loyalty Group: Best Customers: who’s in the Best segment and what to do with it. Each group’s segment has an article like it.
- Customer Segments: every loyalty group is a standard segment you can sync.