Ads Benchmark
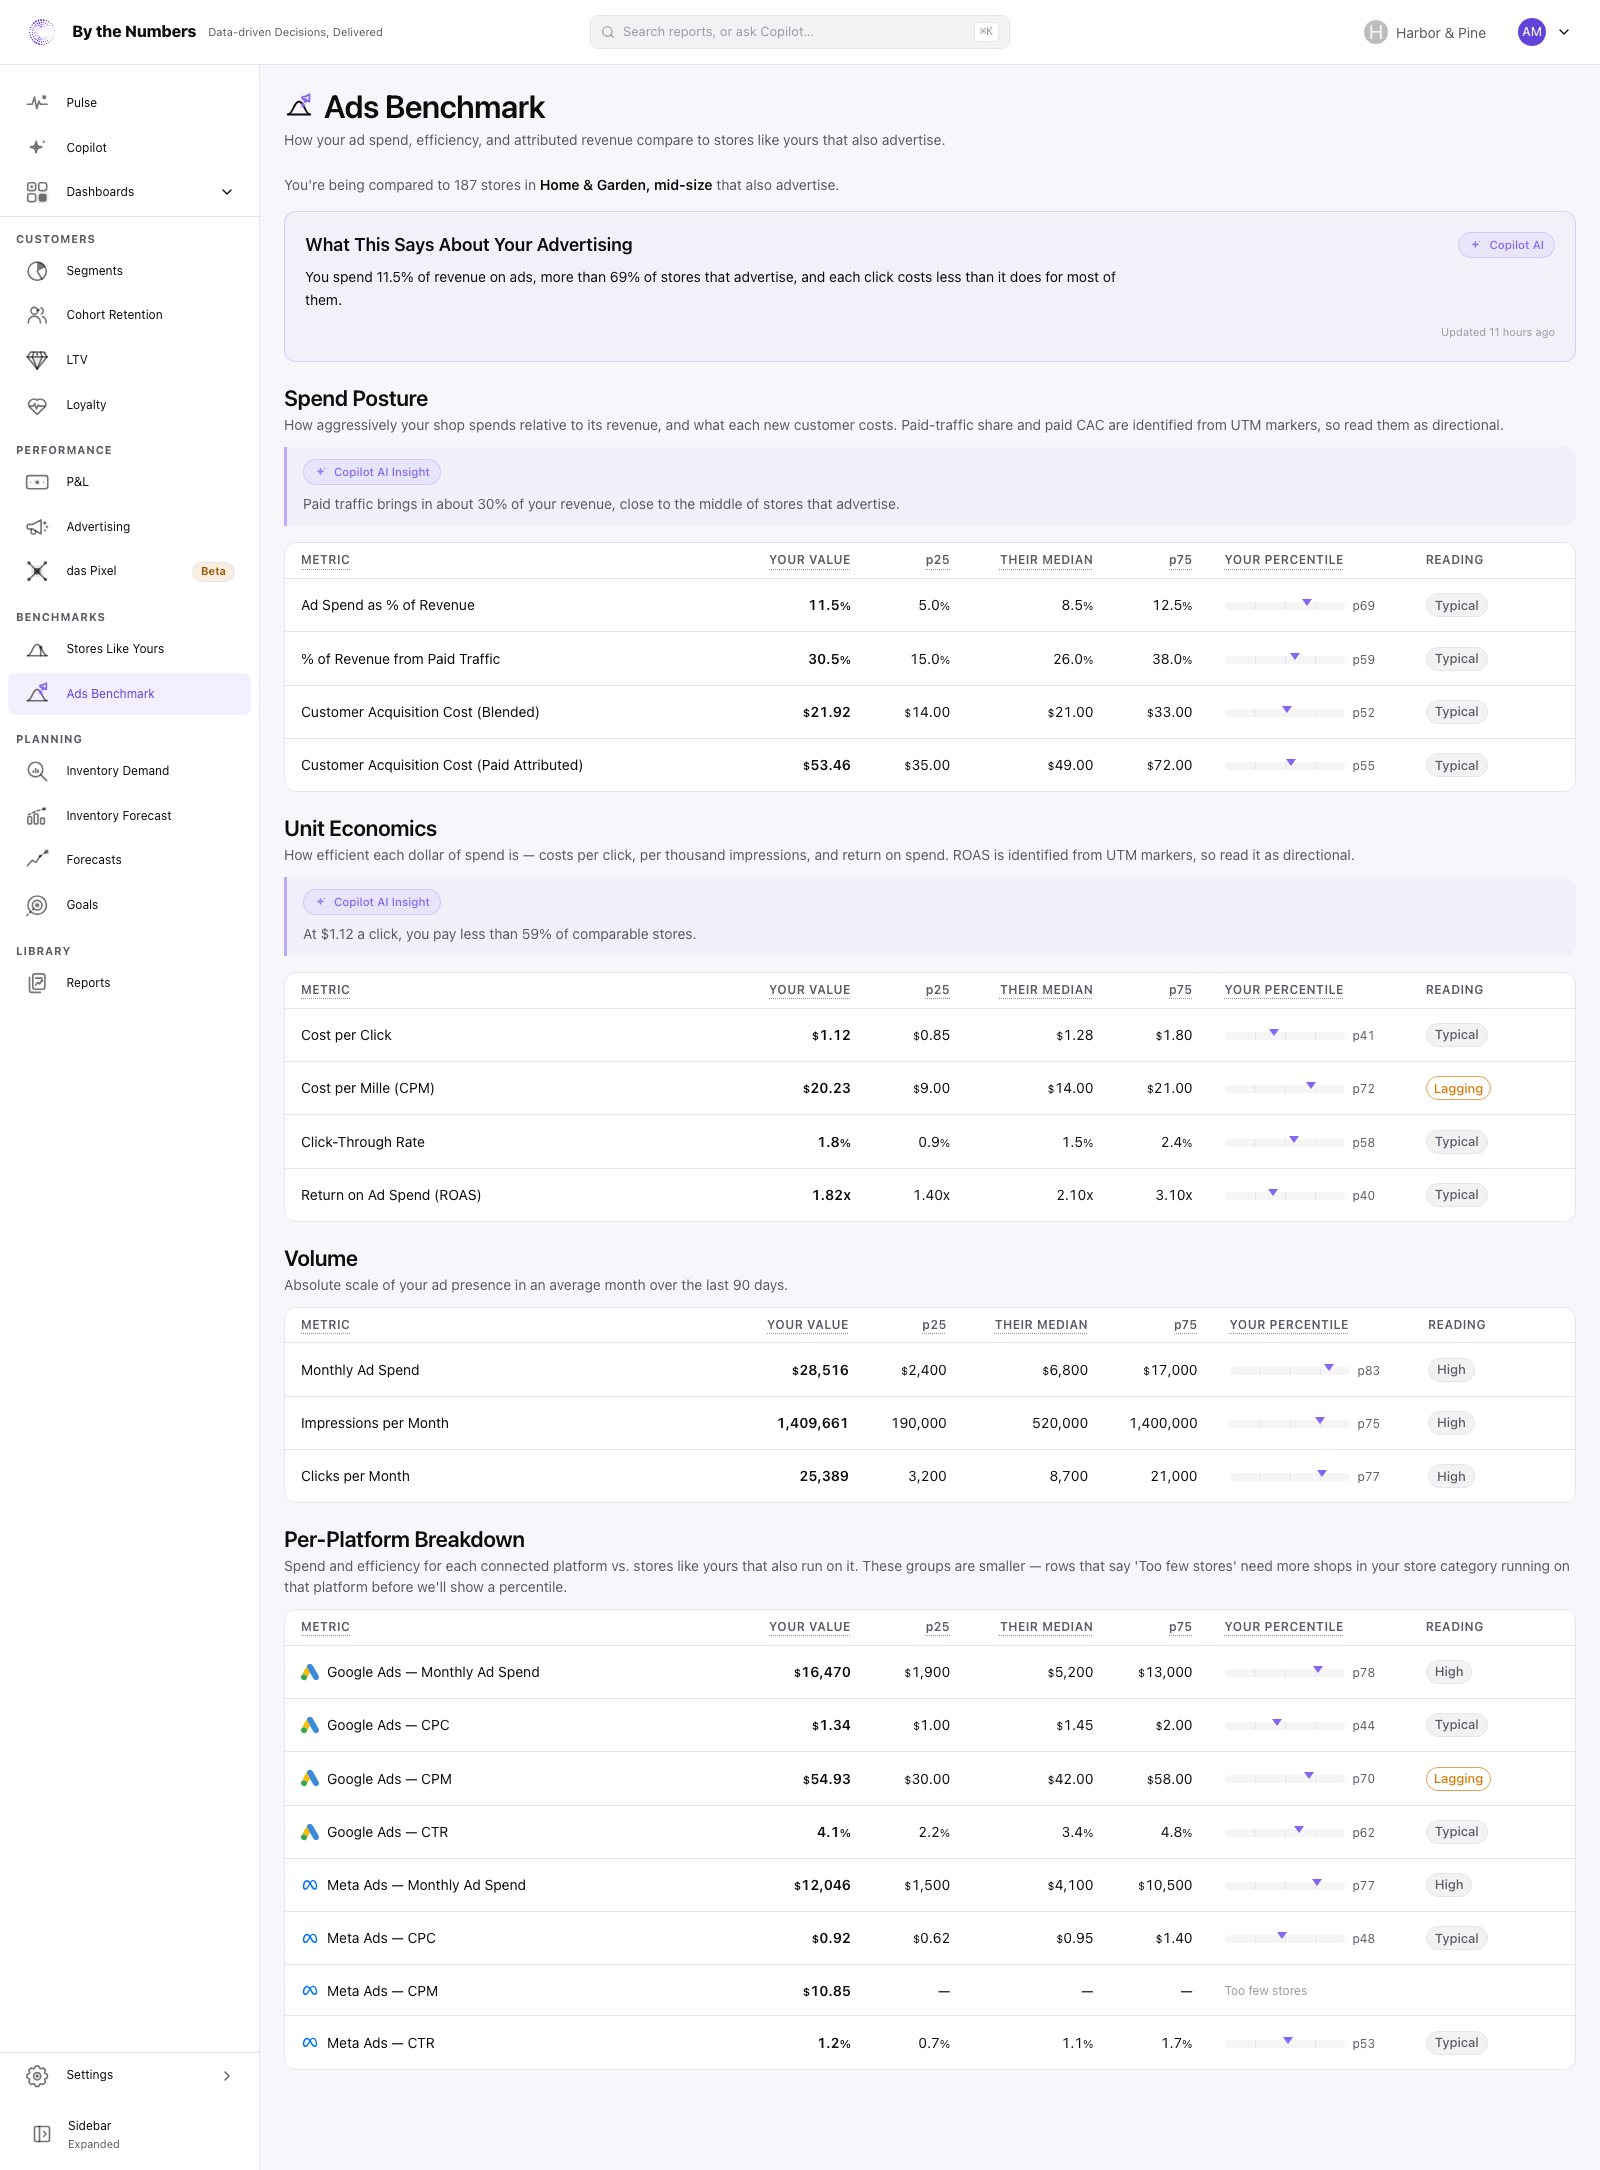
Ads Benchmark shows how your advertising compares with stores like yours that also advertise. It covers how much you spend, what a click and a customer cost, and what your paid orders return, over the last 90 days.
Open Ads Benchmark under Benchmarks in the navigation. It’s new and in beta, and every store can open it. It needs at least one connected ad platform.
How It’s Calculated
Which Stores You’re Compared With
The group is made of stores that use By the Numbers, meet the conditions in Stores Like Yours, and also advertise. A store also advertises when it has a connected ad platform and reported ad spend in the last 90 days.
The group starts with stores that match your category, size band and country. When fewer than 25 match, it widens one step at a time. The steps are your category and size band in any country, then your category in any size and country, then all stores.
Stores Like Yours explains each of those.
Each row widens on its own. The line above the tables names the narrowest group any row reached, followed by that also advertise. It adds Some metrics use a wider group when fewer than 25 stores match yours. when any row used a wider one.
Before You See a Comparison
Without a connected ad platform, the page shows Connect an Ad Platform to See Benchmarks, with an Open Integrations button. Once you connect one, the page fills in after the next nightly update, within 24 hours.
A store with no ad spend in the last 90 days has no figures of its own. Its rows show a dash under Your Value.
The Measures
Spend and clicks come from your connected ad platforms. Revenue comes from your Shopify orders, from the last 90 days, leaving out canceled orders and orders whose payment was voided or expired. Revenue means each order’s total after discounts, with tax and shipping, before refunds.
Money amounts are converted to US dollars so stores in different currencies compare fairly, then shown in your store currency. An ad account that bills in another currency is first converted to your store currency at the latest exchange rate. Earlier days use that same rate, and spend in a currency with no rate on file isn’t converted.
Spend Posture
- Ad Spend as % of Revenue: your ad spend as a share of your revenue.
- % of Revenue from Paid Traffic: the share of your revenue from orders marked as paid.
- Customer Acquisition Cost (Blended): your ad spend divided by your new customers, the customers whose first-ever order fell in the 90 days.
- Customer Acquisition Cost (Paid Attributed): your ad spend divided by the customers who placed a paid order, new or returning.
Unit Economics
- Cost per Click: ad spend divided by clicks.
- Cost per Mille (CPM): ad spend divided by impressions, times 1,000.
- Click-Through Rate: clicks divided by impressions.
- Return on Ad Spend (ROAS): the revenue from paid orders divided by ad spend. It shows only when you have paid revenue.
Volume
- Monthly Ad Spend, Impressions per Month and Clicks per Month: an average month of the 90 days.
Per-Platform Breakdown
Monthly Ad Spend, CPC, CPM and CTR for each platform, such as Google Ads — CPC. A platform counts only if it had spend in the 90 days. Its group is stores that advertise on that platform, so it’s smaller than the group above.
Rows for a platform you don’t advertise on can appear, with a dash under Your Value, when enough other stores do.
What Makes an Order Paid
By the Numbers works this out from UTM tags, not from your ad platforms or das Pixel. An order counts as paid when its UTM medium is one of these:
cpc, ppc, cpm, paid, paid_search, paidsearch, paid_social, paidsocial, paid-social, social-paid, display, retargeting
When the order has no tag of its own, the tag on the customer’s last visit is used. A UTM source on its own, such as utm_source=google, doesn’t count, because it can just as well come from organic search as from an ad.
An order also counts when the landing page of that last visit carries an ad click ID, such as gclid, fbclid, ttclid or msclkid. Shopify sends the landing page without the part of the address after the question mark, so no order matches this today.
That makes % of Revenue from Paid Traffic, Customer Acquisition Cost (Paid Attributed) and ROAS directional. They miss paid orders that carry no tag, and they count tagged orders that weren’t paid. How to Tag Your Ads With UTM Parameters shows how to tag your ads.
This ROAS isn’t the ROAS on the Advertising page, which uses das Pixel. It isn’t Reported ROAS either, which is each platform’s own figure.
Reading the Table
The columns work as they do in Stores Like Yours: Your Value, p25, Their Median, p75, Your Percentile and Reading. The percentile runs from 5 to 95. A row reads Too few stores when fewer than 25 stores can be compared.
Which way is good depends on the measure:
- Lower is better: Cost per Click, Cost per Mille (CPM) and both acquisition costs.
- Higher is better: Click-Through Rate and ROAS.
- Neither: Ad Spend as % of Revenue, % of Revenue from Paid Traffic, Monthly Ad Spend, Impressions per Month and Clicks per Month. How much you spend isn’t good or bad until you read it beside the efficiency rows. These read High, Typical or Low in grey.
Each platform’s rows follow the rule of the measure they repeat.
Copilot AI Insights
For stores that can use Copilot, What This Says About Your Advertising opens the page. Short Copilot AI Insight notes appear under a section’s heading when there’s something to say. Copilot writes them when you first open the page, and reuses them for 24 hours or until the figures change.
What Good Looks Like
There’s no target to hit. A store that spends more isn’t doing better or worse: read the spend rows beside the efficiency rows.
Look for a cost that’s low and a return that’s high. A Reading of Strong on Cost per Click with a Lagging one on ROAS says clicks are cheap, but your paid orders return less than most stores’ do.
What to Do About It
- Check your UTM tags first. An order needs a paid UTM medium to count as paid. Ads with no tag, or only a UTM source, make ROAS and Customer Acquisition Cost (Paid Attributed) look worse than they are.
- Compare the platform rows. A platform with a Needs Attention cost per click is the first place to look.
- Weigh it against your own numbers. The Advertising page shows what each platform reports and what das Pixel measured.
- Check the group. A row on a wider group compares you with stores that can differ from yours in size or category.
Where to Find It
- Ads Benchmark: under Benchmarks in the navigation, and under Benchmarking in Reports.
- Stores Like Yours: the same comparison for the whole store.
- Integrations: where you connect an ad platform.