How to Pin a Report to a Dashboard
At the end of these steps, a report will be on a dashboard as a card, showing its chart or table next to your other cards. You can pin from the report itself, from the Reports page, or from the dashboard.
Before You Start
To pin to a shared dashboard, you need the Edit dashboards permission. You can pin to a personal dashboard you created without it.
Steps
From a Report
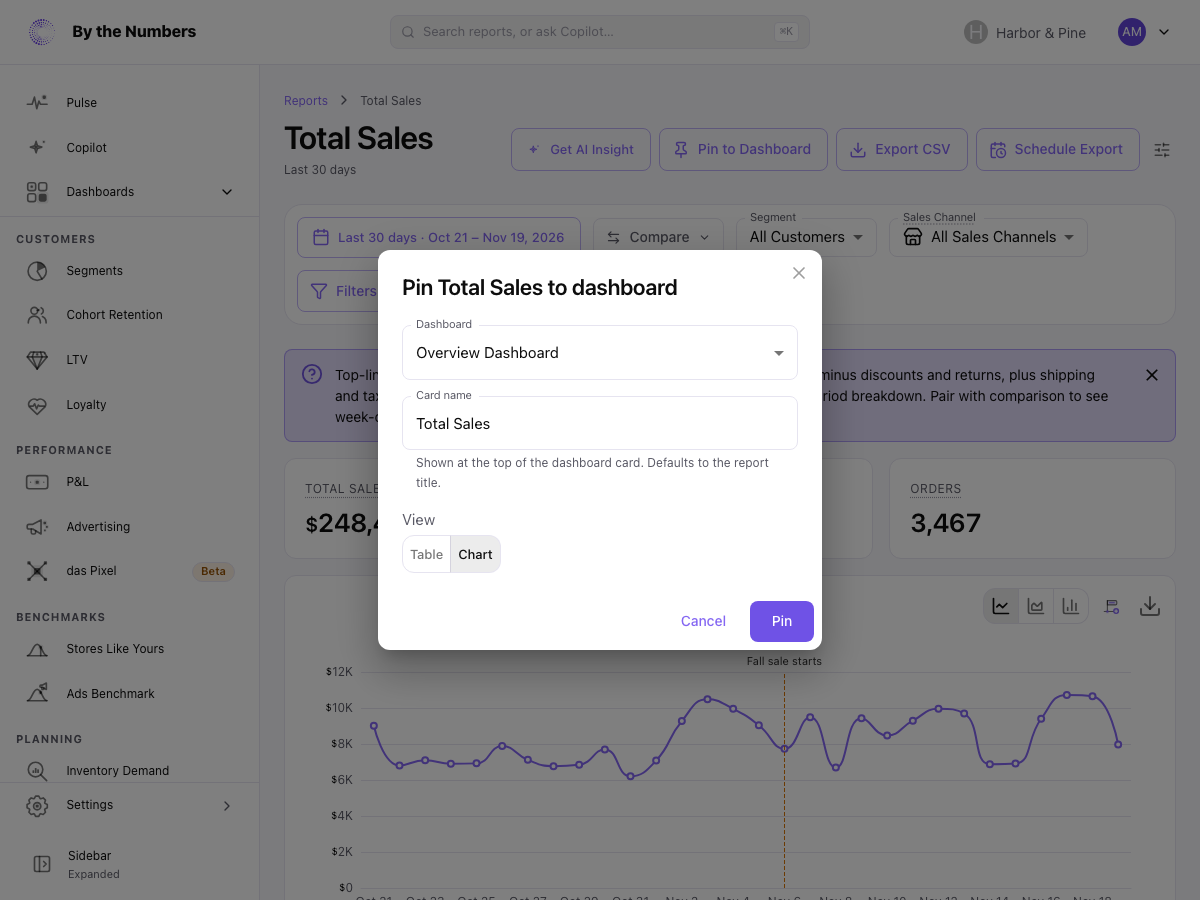
- Open the report and choose Pin to Dashboard.
- Under Dashboard, choose where the card goes. Only dashboards you can pin to are listed: shared ones under Shared with Shop and yours under Personal. To make a new dashboard for it, choose + New Dashboard…, enter its name, and choose Personal or Shared with Shop. A shared dashboard needs the Edit dashboards permission, so without it the new dashboard is personal.
- Change the Card name if you like. It’s shown at the top of the card and starts as the report’s title.
- Under View, choose Table or Chart. Map reports offer Map instead, and cohort, funnel, journey and traffic reports offer Visualization.
- Choose Pin.
If the report has advanced filters applied, they’re saved with the card. The card’s date range, comparison and segment follow the dashboard.
Most report pages have Pin to Dashboard. For a report whose page doesn’t, use one of the other two ways below.
From the Reports Page
- Open Reports and find the report.
- Choose the pin icon on its card. The number beside the icon is how many dashboards already have it.
- Select each dashboard you want it on.
Clearing a dashboard removes every card for that report from it. Each change shows a message with Undo. A dashboard you can’t pin to is grayed out, but its checkbox still shows whether the report is on it.
To pin the report to a dashboard that doesn’t exist yet, choose Create new dashboard… and fill in the form. The report is pinned to the new dashboard, and that message has no Undo.
From the Dashboard
- Open the dashboard’s menu and choose Add Card…. On an empty dashboard, choose Add Card.
- Search for the report by name or description, or narrow the list with Sliced by, Theme and Visualization.
- Choose the report. It’s added straight away.
- Choose Done when you’ve added everything you want.
A report already on the dashboard is marked “Already pinned — adds another copy.” Pinning it again adds a second card, which you can give different card filters.
What Happens Next
The new card goes in the first free space on the dashboard, 1 column wide and 1 row tall. When you pin from a report, the confirmation has a View dashboard link.
From there you can drag the card by its title to move it, and drag its bottom-right corner to resize it. The card’s menu lets you rename it, switch between chart and table, give it its own filters with Card filters…, or take it off with Remove from dashboard.